Map Control for WinForms, V2.0

We have just released a new version of the Mapping component for WinForms. The release contains some exciting new features, details below:

Street maps

You can render street maps in OpenStreetMap format by adding a StreetMapLayer instance to the MapView. In order to load a street map, create a new StreetMapLayer object and call its Map‘s LoadFromXml method to load the corresponding *.osm file. The pens and brushes used for drawing the map are stored within the StreetMapPens and StreetMapBrushes collections in the static StreetMapFeatures class. You can define additional pens and brushes for drawing and painting certain map features by using the StreetMapLayer’s AddPen and AddBrush methods.

MindFusion Map Control for WinForms: Street maps

MindFusion Map Control for WinForms: Street maps

Zoom control

The ZoomControl class lets users change interactively the current zoom level and scroll position of a MapView. To set it up, add a ZoomControl to the form, place it anywhere over a MapView, and set the control’s Target property to that view. Set the ZoomStep and ScrollStep properties to specify the amount added to view’s zoom level or scroll position by ZoomControl’s buttons. You can customize the control’s appearance by setting properties such as Fill, BorderColor, CornerRadius and TickPosition.

MindFusion Map Control for WinForms: Zoom

MindFusion Map Control for WinForms: Zoom

Multiple selection

Now it’s possible to select multiple decorations or map shapes by drawing a selection rectangle. To enable that, set the Behavior property to Select. Selected elements are stored in the Selection collection of respective layer objects.

API changes

  • The type of MapElement‘s Label property has been changed from string to Label class.
  • The FontName and FontSize properties have been moved from MapElement to Label.
  • Type of Layers property changed from List to ObservableCollection.

About MindFusion Mapping for WinForms: Use this powerful WinForms control to provide your software with maps of your choice that include any type of administrative, geographical and political data. The component offers a comprehensive data set of mapping data, which is royalty-free and can easily be integrated into any MindFusion map. You can organize the map data in layers and combine several data files to deliver to the end user the exact map that is required. The advanced pan and zoom options offer a convenient way for the users to inspect in details even a large map. The control fully supports the OpenStreetMap format and lets you create precise and elegant street maps. The API is neatly organized and dutifully documented with plenty of sample code that guarantees you can easily build the map your application demands without compromises on speed and quality. More on Mapping for WinForms here.

MindFusion Diagram Component for Xamarin Beta Version

MindFusion is pleased to announce the first release of its Diagramming component for Xamarin. The control is packed with a comprehensive set of features that allows programmers to create, modify and render various types of diagrams fast and easy.

Among its core features are table and container nodes, tree nodes, shape library with a rich choice of predefined node shapes, diagram links with various arrowhead styles and different connector types – Bezier, straight, polyline.

Each Xamarin diagram you build with the component is fully interactive – users can drag, move, resize, create and delete all types of nodes and links. The control fires events for the tiniest user gestures so your software can perform the necessary operations as a result. The event set includes every single action – from editing a link to deleting a node.

The chart’s appearance is fully customizable. Each element of the diagram exposes its complete set of style settings like brush, pen, font, which give you full control over its looks. You can apply glass and aero visual effects for glossier look.

You can organize content in layers for better visualization and use a grid for more precise location and alignment of diagram elements. Ready flowcharts can be quickly persisted into XML with the call of a single method.

We invite you to test the initial MindFusion Diagramming for Xamarin Release. Direct download is available from this link:

Download MindFusion Flowchart Component for Xamarin Beta Version

The download includes a sample project and detailed API reference.

Your questions, comments and feedback are welcomed. Use email support@mindfusion.eu or write at our discussion board. Either way we’ll be glad to receive and answer your feedback!

MindFusion Diagram control for Xamarin

MindFusion Diagram control for Xamarin

Nested DataRanges in MindFusion Report Application

In this tutorial we are going to build a report with nested data ranges. In our case, we are going to retrieve all categories from the sample Norhtwind database. For each category we will get all products in it, which is the nested data range.

I. Preparing the Project

We create a new WinForms project and add a new DataSet from the Nortwind database. We choose all fields from the Categories and Products tables. Then we add a new item from the menu “Project -> Add -> New Item -> MindFusion Report” from the dialog that appears.

Adding the MindFusion Report item.

Adding the MindFusion Report item.

Drag and drop the nwindDataSet, CategoriesTableAdapter and ProductsTableAdapter on the report form. Finally, in the code behind fill the two adapters:

 productsTableAdapter1.Fill(nwindDataSet1.Products);
 categoriesTableAdapter1.Fill(nwindDataSet1.Categories); 

II. The Categories DataRange

We create the first data range by right clicking on the newly created report. There we see “Create Data Range from Data Source”. We choose the categories table and two fields – CategoryName and Picture. When the data range is generated we resize the picture to make it bigger.

Create DataRange context menu.

Create DataRange context menu.

III. Running the Report

We would use MindFusion ReportViewer to preview what we’ve done so far. We drag it from the Toolbox and place it on the form, which shows when the application runs. We compile the project and see that the Report1 class that we’ve created appears in the Toolbox, under the Data tab. This means we can create instances of our report just by drag and drop. We drag the Report1 icon and drop it on Form1. We have a report11 instance, which we assign to the Report property of the ReportView in the property grid.

Dragging the Report1 item.

Dragging the Report1 item.

Finally, we run the report:

report11.Run();

IV. The Nested DataRange

It’s time to create the second DataRange. We right-click the Report1 form and choose again “Create DataRange from Data Source.” This time we choose the Products table and we choose ProductName, UnitsInStock and UnitPrice fields. This time we check the “Generate Header” checkbox at the bottom. The second DataRange is ready. Nesting it is very easy. We resize the first DataRange to make it wider and just drag and drop the second DataRange in it. What is important is to set the MasterDetailRelation property. It must be the name of the relation between the two tables that provide data for the two DataRange-s. We can see it by clicking on the nwindDataSet -> “Edit DataSet with Designer. There we click on the relation between or two tables and see it is called “CategoriesProducts”. We place this name as a value to the MasterDetailRelation property.

Master detail relationship between the Products and Categories table.

Master detail relationship between the Products and Categories table.

V. Run the report

We run the report and see that everything is in place: the categories are listed with their picture, each category lists all its products.

VI. Style Adjustments

Finally let’s add some appearance optimizations that will make the report look better and thus be easier to read. First, we make the background of the Category label darker.

Then we make the product lines with alternating colors. This is done in the property grid for the dataRange2 object -> AlternatingBackground property.

We add a light gray border to the first data range with the Border property editor and we add a bottom margin of 30 mm. Here is the final look of the report:

Nested DataRange-s: the final report.

Nested DataRange-s: the final report.

You can download the sample from this link:

Download Nested DataRanges MindFusion Reporting Sample

More about MindFusion Reporting for WinForms component can be found here.

Create a musical score writer using MindFusion diagram component.

In this example we’ll show how to use various features of MindFusion.Diagramming API to create a musical score editor:

Custom node types
We’ll create a StaffNode class to represent the staff, and NoteNode class to represent a musical note.

Grouping
NoteNodes will be attached to the StaffNode they were dropped onto (or nearby). If users move the staff around, the notes from the group will follow it.

Custom drawing logic
We’ll show how to draw custom graphics by overriding DrawLocal method of base DiagramNode class.

Using SVG images
We’ll show how to load an SVG image (for the G clef) and draw it as part of staff graphics.

NodeListView control
NodeListView contains prototypical node instances whose clones are added to the diagram using drag-and-drop operations. We’ll add a staff and several notes to the list to let users drag them to the score diagram.

The completed sample project can be downloaded from this link:
ScoreWriter.zip

Let’s start by defining StaffNode class to draw staves in the score diagram, and implement its Draw methods to draw five lines:

public class StaffNode : DiagramNode
{
	public StaffNode()
	{
		var rect = Bounds;
		rect.Width = 200;
		SetBounds(rect, false, false);

		// disable vertical resize
		EnabledHandles =
			AdjustmentHandles.ResizeMiddleLeft |
			AdjustmentHandles.Move |
			AdjustmentHandles.ResizeMiddleRight;
	}

	public StaffNode(StaffNode prototype) : base(prototype)
	{
	}

	public override void DrawLocal(IGraphics graphics, RenderOptions options)
	{
		base.DrawLocal(graphics, options);

		for (int i = 0; i < 5; i++)
		{
			float y = i * Bounds.Height / 4;
			using (var pen = EffectivePen.CreateGdiPen())
				graphics.DrawLine(pen, 0, y, Bounds.Width, y);
		}
	}

	public override void DrawShadowLocal(IGraphics graphics, RenderOptions options)
	{
	}
}

Next, load an SVG drawing representing G clef and draw it at appropriate position. We’ll also override GetRepaintRect method to accommodate for parts of the clef that are drawn outside the staff’s boundaries:

static SvgContent gClef;

static StaffNode()
{
	gClef = new SvgContent();
	gClef.Parse("GClef.svg");
}

public override void DrawLocal(IGraphics graphics, RenderOptions options)
{
	// ...

	var rect = GetLocalBounds();
	rect.Inflate(0, 8);
	rect.X = 2;
	rect.Width = 14;
	gClef.Draw(graphics, rect);
}

public override RectangleF GetRepaintRect(bool includeConnected)
{
	var rect = base.GetRepaintRect(includeConnected);
	rect.Inflate(0, 8);
	return rect;
}

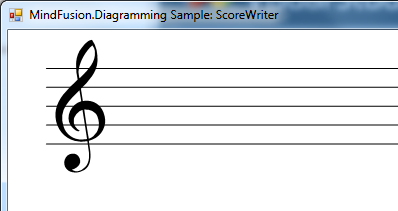
Create an initial StaffNode instance from Form.Load event:

var initialStaff = new StaffNode();
initialStaff.Move(10, 10);
diagram.Nodes.Add(initialStaff);

If you run the project now, you should see the following diagram:
score writer diagram in c#

Next, define the Duration enumeration and NoteNode class to represent musical notes of various durations:

enum Duration
{
	Whole,
	Half,
	Quarter,
	Eighth,
	Sixteenth
}

class NoteNode : DiagramNode
{
	public NoteNode()
	{
		Bounds = new RectangleF(0, 0, 6, 6);
		Duration = Duration.Whole;
	}

	public NoteNode(Duration duration)
	{
		Bounds = new RectangleF(0, 0, 6, 6);
		Duration = duration;
	}

	public Duration Duration { get; set; }

	int position = 0;
}

Implement NoteNode.Draw methods as follows:

public override void DrawLocal(IGraphics graphics, RenderOptions options)
{
	base.DrawLocal(graphics, options);

	var cx = Bounds.Width / 2;
	var cy = Bounds.Height / 2;

	var gs = graphics.Save();
	graphics.TranslateTransform(cx, cy);
	graphics.RotateTransform(-10);
	graphics.TranslateTransform(-cx, -cy);

	var bounds = GetLocalBounds();
	bounds.Inflate(0, -bounds.Width / 10);
	var path = new GraphicsPath();
	path.AddEllipse(bounds);

	if (Duration == Duration.Whole || Duration == Duration.Half)
	{
		bounds.Inflate(-bounds.Width / 8, -bounds.Width / 6);
		path.AddEllipse(bounds);
	}
	graphics.FillPath(Brushes.Black, path);

	graphics.Restore(gs);

	if (position < -1 || position > 8)
	{
		// draw ledger lines if above or below staff
		var pen = EffectivePen.CreateGdiPen();
		var staff = (StaffNode)MasterGroup.MainItem;
		var yoff = staff.Bounds.Y - Bounds.Y;
		int i1 = position < -1 ? position : 9;
		int i2 = position < -1 ? -2 : position;
		for (int i = i1; i <= i2; i++)
		{
			if (i % 2 != 0)
				continue;
			var y = yoff + i * staff.Bounds.Height / 8;
			graphics.DrawLine(pen, -2, y, Bounds.Width + 2, y);
		}
		pen.Dispose();
	}

	if (Duration != Duration.Whole)
	{
		// draw stem
		float x = Bounds.Width;
		float y = Bounds.Height / 2;
		var pen = new System.Drawing.Pen(Color.Black, 0.5f);
		graphics.DrawLine(pen,
				            x - pen.Width / 2, y,
				            x - pen.Width / 2, y - Bounds.Height * 2);
		pen.Dispose();
	}

	if (Duration == Duration.Eighth || Duration == Duration.Sixteenth)
	{
		DrawFlag(graphics,
				    bounds.Width,
				    bounds.Height / 2 - bounds.Height * 2,
				    bounds.Width + 1,
				    bounds.Height);
	}

	if (Duration == Duration.Sixteenth)
	{
		DrawFlag(graphics,
				    bounds.Width,
				    bounds.Height - bounds.Height * 2,
				    bounds.Width + 1,
				    bounds.Height);
	}
}

void DrawFlag(IGraphics graphics, float x, float y, float w, float h)
{
	float sh = h / 2;
	float sw = w / 3;

	var pen = new System.Drawing.Pen(Color.Black, 0.5f);
	x -= pen.Width / 2;
	graphics.DrawBezier(pen,
			            x, y,
			            x, y + sh,
			            x + sw * 1.2f, y + 2 * sh,
			            x + sw, y + 3 * sh);
	pen.Dispose();
}

public override void DrawShadowLocal(IGraphics graphics, RenderOptions options)
{
}

public override RectangleF GetRepaintRect(bool includeConnected)
{
	var r = Bounds;
	r.Y -= r.Height * 2;
	r.Height *= 3;
	r.Width *= 2;
	return r;
}

Now, drag a NodeListView to the form and populate it from Load handler:

nodeListView.AddNode(new StaffNode());

nodeListView.DefaultNodeSize = new SizeF(6, 6);
nodeListView.AddNode(new NoteNode(Duration.Whole));
nodeListView.AddNode(new NoteNode(Duration.Half));
nodeListView.AddNode(new NoteNode(Duration.Quarter));
nodeListView.AddNode(new NoteNode(Duration.Eighth));
nodeListView.AddNode(new NoteNode(Duration.Sixteenth));

Drag and drop will not work just yet. First, we must enable the DiagramView.AllowDrop property to accept drag-and-drop events. Next, the custom classes must implement a copy constructor and serialization methods to be able to instantiate them through OLE drag events:

public NoteNode(NoteNode prototype) : base(prototype)
{
	Duration = prototype.Duration;
}

protected override void SaveTo(System.IO.BinaryWriter writer, PersistContext context)
{
	base.SaveTo(writer, context);
	context.Writer.Write((int)Duration);
}

protected override void LoadFrom(System.IO.BinaryReader reader, PersistContext context)
{
	base.LoadFrom(reader, context);
	Duration = (Duration)context.Reader.ReadInt32();
}

As a final touch for this example, let’s implement aligning notes to staves’ lines and spaces. First lets declare a helper method that returns the nearest StaffNode at specified location in diagram:

static class DiagramExtensions
{
	static public StaffNode NearestStaff(this Diagram diagram, PointF point)
	{
		var staves = diagram.Nodes.OfType();

		StaffNode nearest = null;
		float minDist = float.MaxValue;

		foreach (var staff in staves)
		{
			if (staff.ContainsPoint(point))
				return staff;

			var borderPoint = staff.GetNearestBorderPoint(point);
			var dist = Utilities.Distance(borderPoint, point);
			if (dist < minDist)
			{
				minDist = dist;
				nearest = staff;
			}
		}

		return minDist < 20 ? nearest : null;
	}
}

Next, implement StaffNode.Align method that aligns its argument to a line or space in the staff:

public PointF Align(PointF point, out int position)
{
	// align to pitch line/space

	float h = Bounds.Height / 8;
	float offset = point.Y - Bounds.Y;
	position = (int)Math.Round(offset / h);
	offset = (float)Math.Round(offset / h) * h;
	point.Y = Bounds.Y + offset;
	return point;
}

Add NoteNode.AlignToStaff method that will find nearest StaffNode and align the note’s position to the staff.

public StaffNode AlignToStaff()
{
	position = 0;

	var staff = Parent.NearestStaff(GetCenter());
	if (staff == null)
		return null;

	var alignedPoint = staff.Align(GetCenter(), out position);
	alignedPoint.X -= Bounds.Width / 2;
	alignedPoint.Y -= Bounds.Height / 2;
	Move(alignedPoint.X, alignedPoint.Y);

	return staff;
}

We can align notes after drag-and-drop from NodeListView by handling diagram’s NodeCreated event. We’ll use the same handler to attach notes to that staff, so that if users move a StaffNode, its attached NoteNodes will follow.

private void OnNodeCreated(object sender, NodeEventArgs e)
{
	var note = e.Node as NoteNode;
	if (note != null)
	{
		var staff = note.AlignToStaff();
		if (staff != null)
			note.AttachTo(staff, AttachToNode.TopLeft);

		note.HandlesStyle = HandlesStyle.MoveOnly;
	}
}

Finally, override NoteNode.CompleteModify to align notes after user moves them to a different position on the staff or to another staff in the score:

protected override void CompleteModify(PointF end, InteractionState ist)
{
	base.CompleteModify(end, ist);

	var staff = AlignToStaff();
	if (staff != null)
		AttachTo(staff, AttachToNode.TopLeft);
	else
	{
		Detach();
	}
}

Let’s run the project and compose some music 🙂
.net diagram control

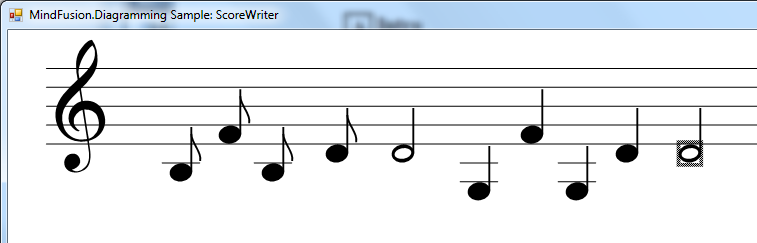
A fully-featured scorewriter software would also allow for drawing rest, sharp and flat symbols, C and F clefs, and some other musical notation features, but these are left as exercise to the reader 😉

The code above uses MindFusion’s .NET API and can be used with Windows Forms, WPF, Silverlight and ASP.NET diagramming components. The Java API for Android and desktop Swing application will look similar, with setter method calls instead of property assignments.

You can download the trial version of any MindFusion.Diagramming component from this page.

Enjoy!

WPF Diagram Control, V3.3.1 and WinForms Diagram Control, V6.3.3

MindFusion is pleased to announce the new releases of two of its popular flowchart control: Diagramming for WinForms, V6.3.3 and Diagramming for WPF, V3.3.1. Both releases have similar new features, which are listed below:

Resize table columns and rows
Columns and rows of a TableNode can now be resized interactively if its AllowResizeColumns or AllowResizeRows properties are enabled. In order to resize, move the mouse pointer to the border line on column’s right side or row’s bottom side until it shows resize cursor and start dragging. The control raises TableColumnResizing and TableRowResizing events to let you validate new size or prevent resizing some elements. The TableColumnResized and TableRowResized events are raised after the operation completes.

Barcode nodes
The BarcodeNode class displays EAN, UPC or QR barcodes as node’s content. In-place edit operations let users enter new numeric codes for 1D codes or text strings for QR codes. The barcode format is specified via the Format property, the encoded number or text is set via Content, and color of 1D bars / 2D modules via BarColor.

Barcode diagram nodes

Barcode diagram nodes

New Features in Diagramming for WPF, V3.3.1

ShapeDesigner improvements

  • The ShapeDesigner control supports undo. Call its Undo or Redo methods to respectively undo or redo a change done to the designed shape.
  • ZoomFactor property added to ShapeDesigner. It also supports interactive zoom in/out via mouse wheel.
  • The SelectedElement property exposes the graphic element currently selected in ShapeDesigner canvas. You can bind to its stroke and brush properties to create alternative user interface for editing element attributes.

Miscellaneous

  • NodeConstraints.KeepInsideDiagram prevents a node from leaving diagram boundaries during user interaction (the older RestrictItemsToBounds property does not stop nodes from leaving diagram area but returns them to original position if dropped outside).
  • dashed selection frames are now drawn in two colors and should be visible on both the default white background and custom darker backgrounds. You can change the second dash color via HandlesVisualStyle.DashBackground property.
  • set the WhileModifying flag in RoutingOptions.TriggerRerouting to reroute links while users drag their end points.
  • custom connection point classes can now override ConnectionPoint.NearestAnchorPoint to implement custom anchor point selection logic; the method is now also called at the beginning of interactive link creation.

New in Diagramming for WinForms, V6.3.3

Miscellaneous

  • the component now selects better end points for auto-routed links when using WhileCreating and WhileModifying routing modes;
  • custom connection point classes can now override ConnectionPoint.NearestAnchorPoint to implement custom anchor point selection logic; the method is now also called at the beginning of interactive link creation.
  • NodeConstraints.KeepInsideDiagram prevents a node from leaving diagram boundaries during user interaction (the older RestrictItemsToBounds property does not stop nodes from leaving diagram area but returns them to original position if dropped outside).
  • SvgNode supports SVG images with vector-effect=’non-scaling-stroke’ stroke attributes.
  • improved default Pen for dash-frame selection handles style. Dashed frames should now be visible on both the default white background and custom darker backgrounds.
  • ZoomControl can now be used with other components by MindFusion and has been moved to MindFusion.Common.WinForms assembly and namespace.

You are welcome to download the trial version for each control from the following links:

Diagramming for WinForms, V6.3.3 Trial Version Download

Diagramming for WPF, V3.3.1 Trial Version Download

If you have questions or run into problems using the components you can use the Diagramming components forum, the help desk or write us at support@mindfusion.eu. Our support team will be pleased to help you.

About MindFusion.Diagramming for WinForms: A programming component that provides any WinForms application with a full set of features for creating and customizing all types of diagrams, flowcharts, schemes, hierarchies, trees, graphs etc. The control provides numerous ways to save and load a diagram, six auxiliary controls and more than 10 automatic graph layout algorithms. Diagram elements include scrollable tables, container nodes, multi-segment arrows, custom diagram item types and many more. Further details here.

Diagramming for WinForms is a royalty-free component, clients get 12 month upgrade subscription when buying a license. The source code is also available for purchase. Visit the buy page for a list with the current license prices.

About MindFusion.Diagramming for Wpf: Designed and developed to be easy to integrate, use, and customize, this native WPF flowchart component places at your disposal every single feature you would ever need to create diagrams, graphs, schemes, org charts, DB relationships, genealogy trees, class hierarchies and many more. Its long list of style options gives you complete control over the appearance of the diagram. With a set of eight automatic layouts you are sure to find the arrangement that suits perfectly your WPF application.

The diagram control boasts a long list of events, properties and methods for user interaction, item creation, data input and output. You can read the full features list here. The online demo shows samples that demonstrate various capabilities of the control. The licensing scheme and prices are uploaded at the buy page. Source code is also available.