MindFusion has released ASP.NET Pack 2014.R2. Here is a list of the new features:
 MindFusion.Diagramming for WebForms
SVG nodes in Canvas mode
The new SvgNode class represents nodes that can display SVG drawings. The class renders SVG graphics instead of Image, and on top of the geometry rendered by the base ShapeNode class. You can specify the SVG drawing of the node through its Content property.
Importing of diagrams from SVG
The new SvgImporter class lets you import Scalable Vector Graphics files (*.svg) into MindFusion.Diagramming. Each top-level SVG group element is imported as a separate SvgNode, whose Content is set to the group’s child elements.
Tree map layout
Tree maps represent hierarchies by nesting child nodes within their parents, where the areas of leaf nodes are proportional to their Weight values. Unlike other layout algorithms, TreeMapLayout expects hierarchies to be defined via grouping or containment (see AttachTo method and ContainerNode class), and will ignore any links in the diagram. The diagram area covered by the topmost nodes in a hierarchy is specified via the LayoutArea property. By default, the layout tries to keep the ratio of node sides as close as possible to one.
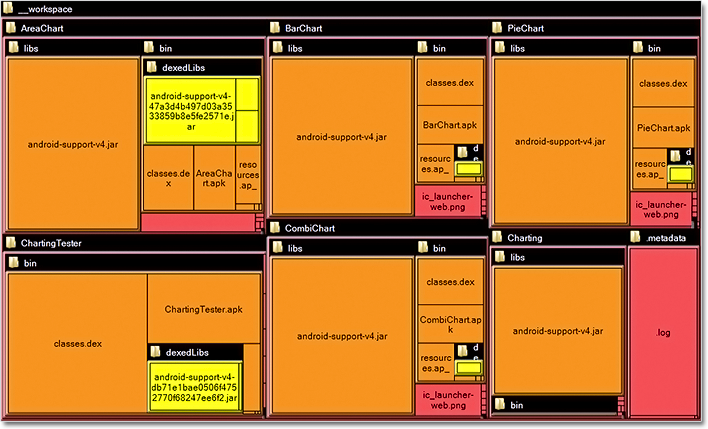
The tree map layout.
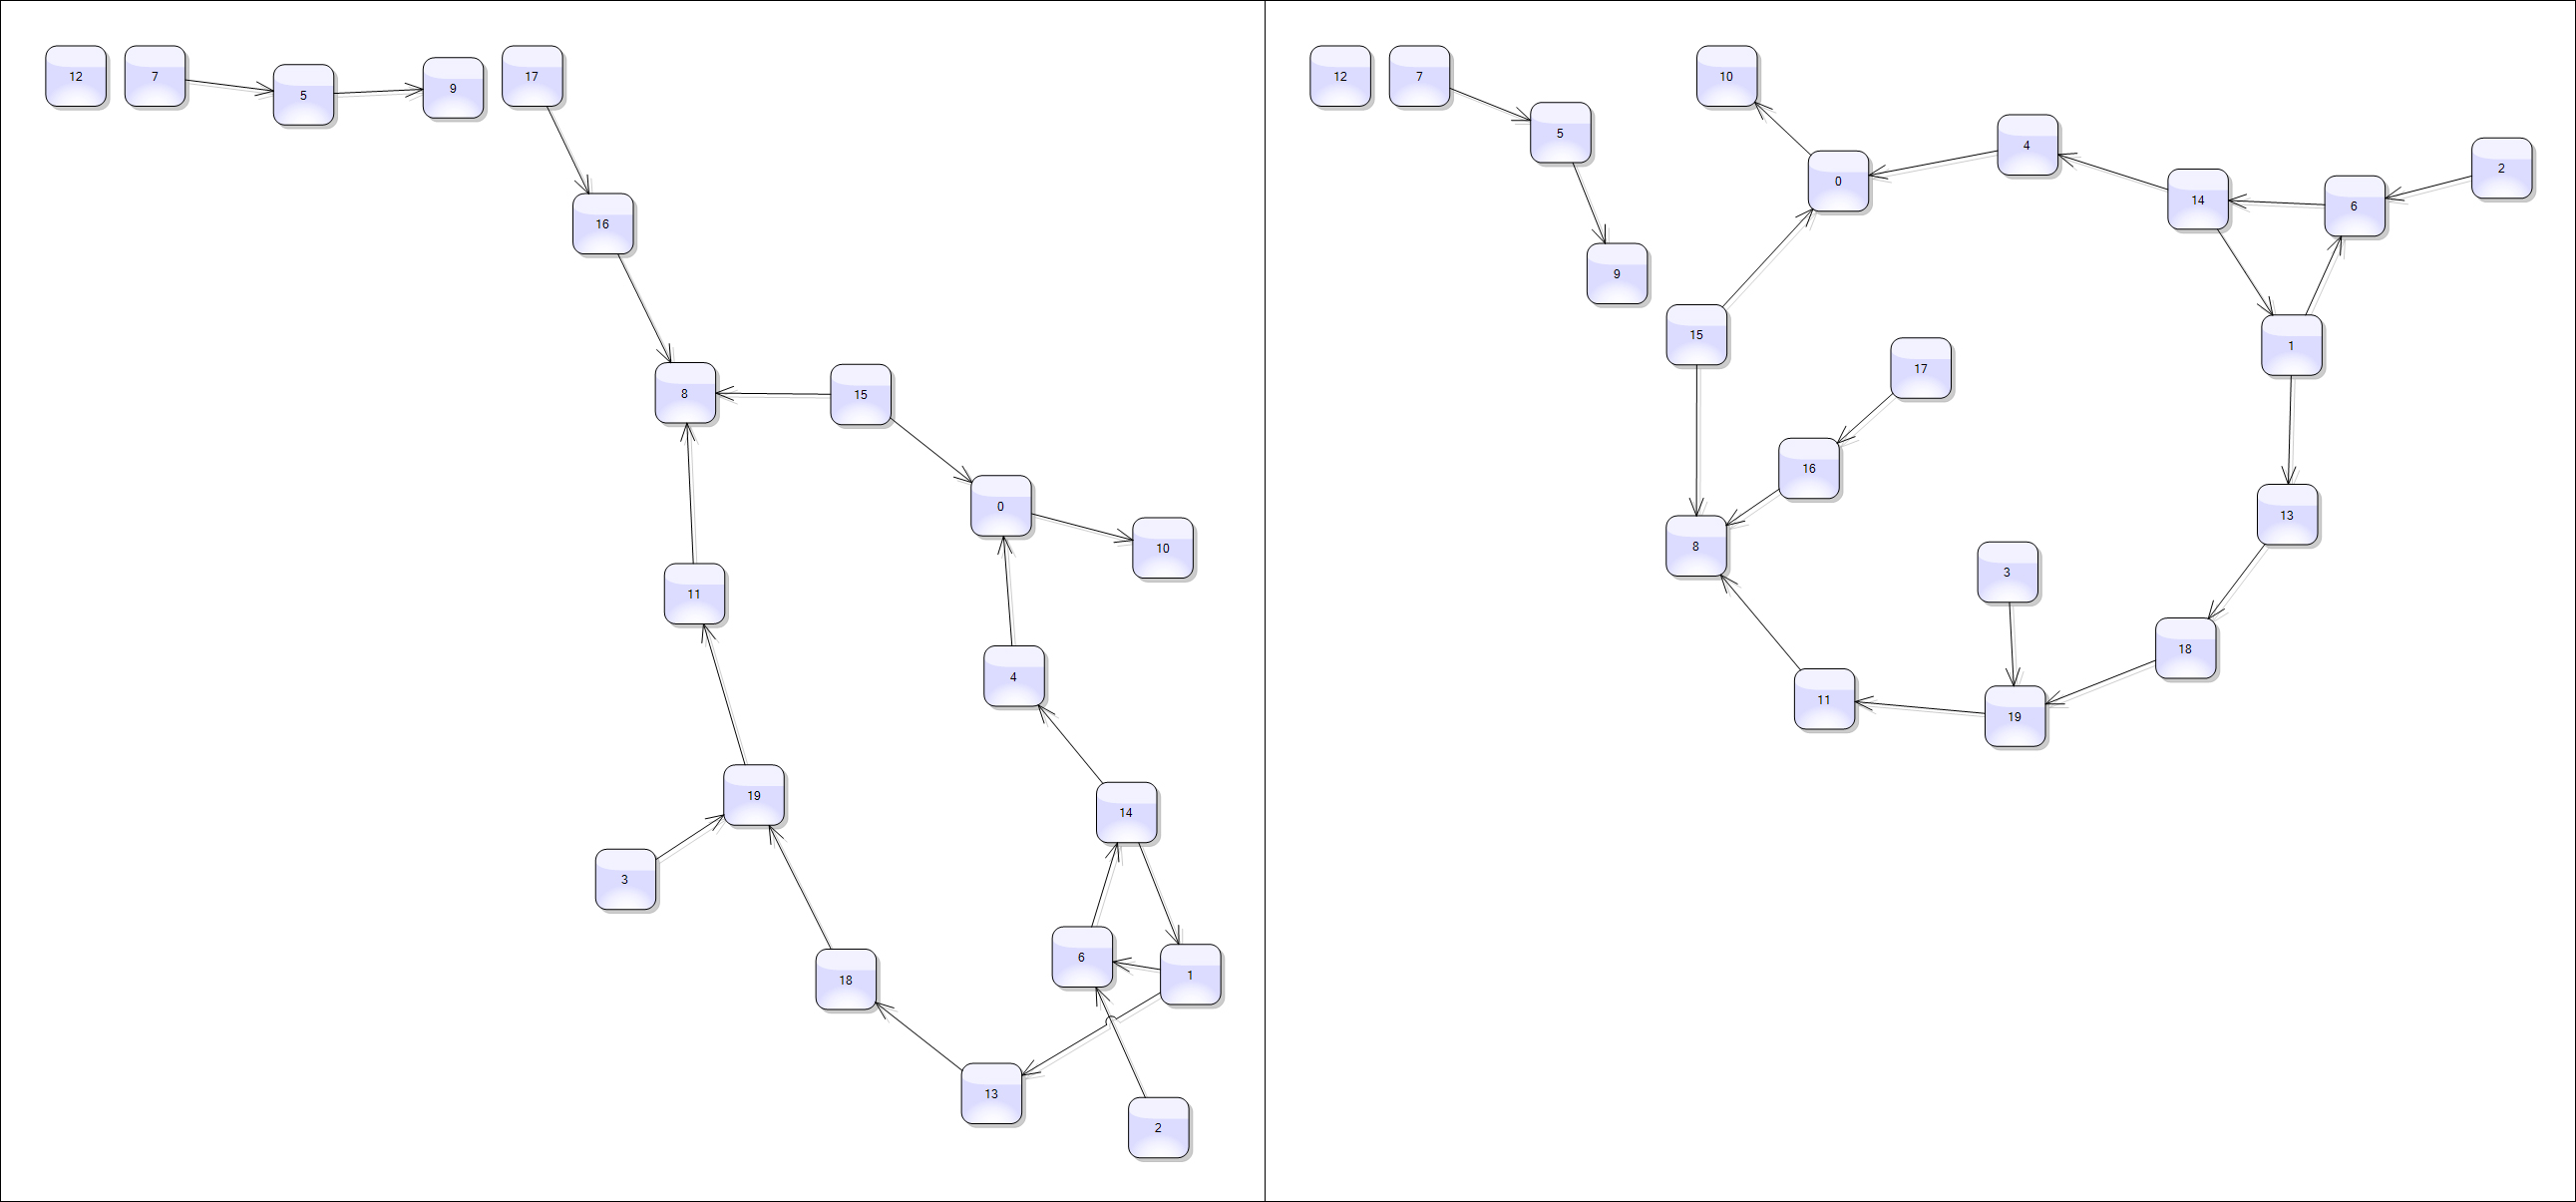
Decision flowchart layout
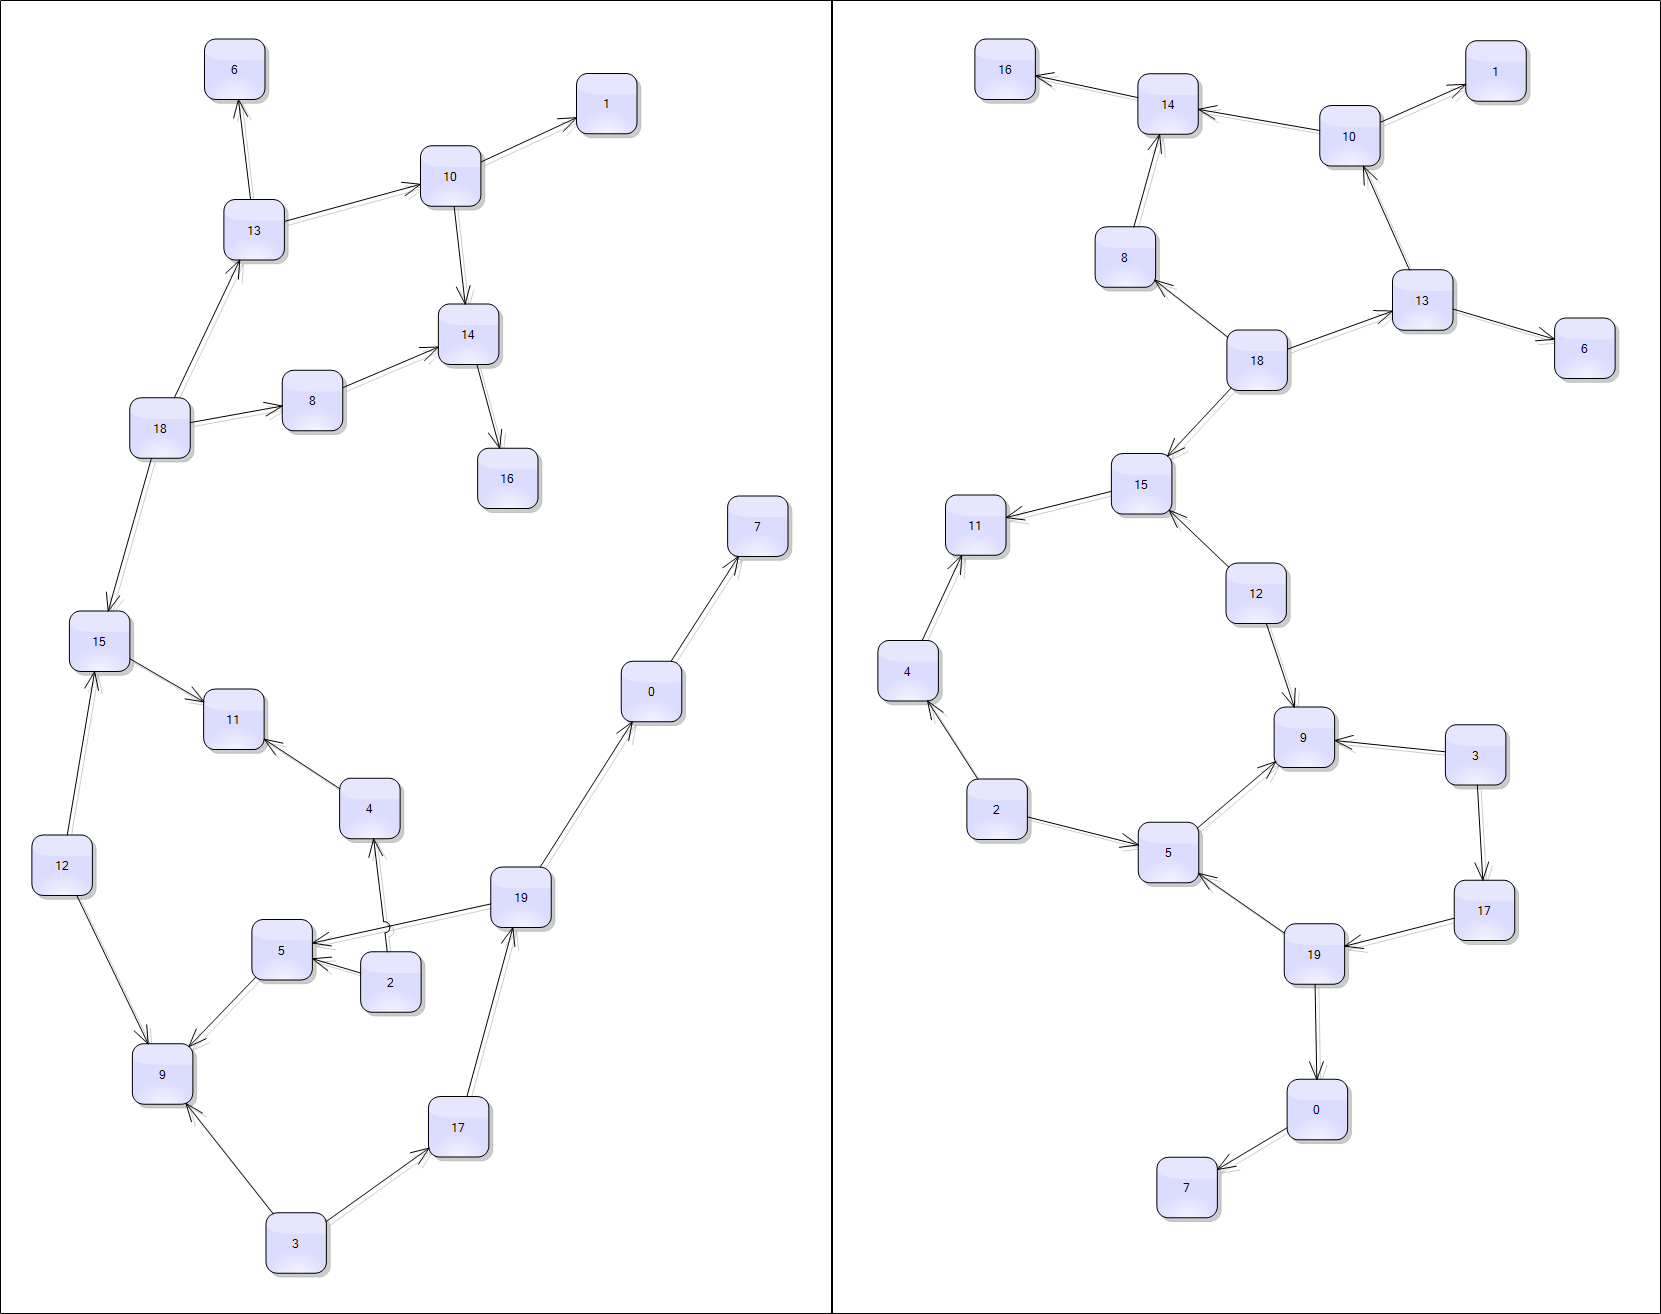
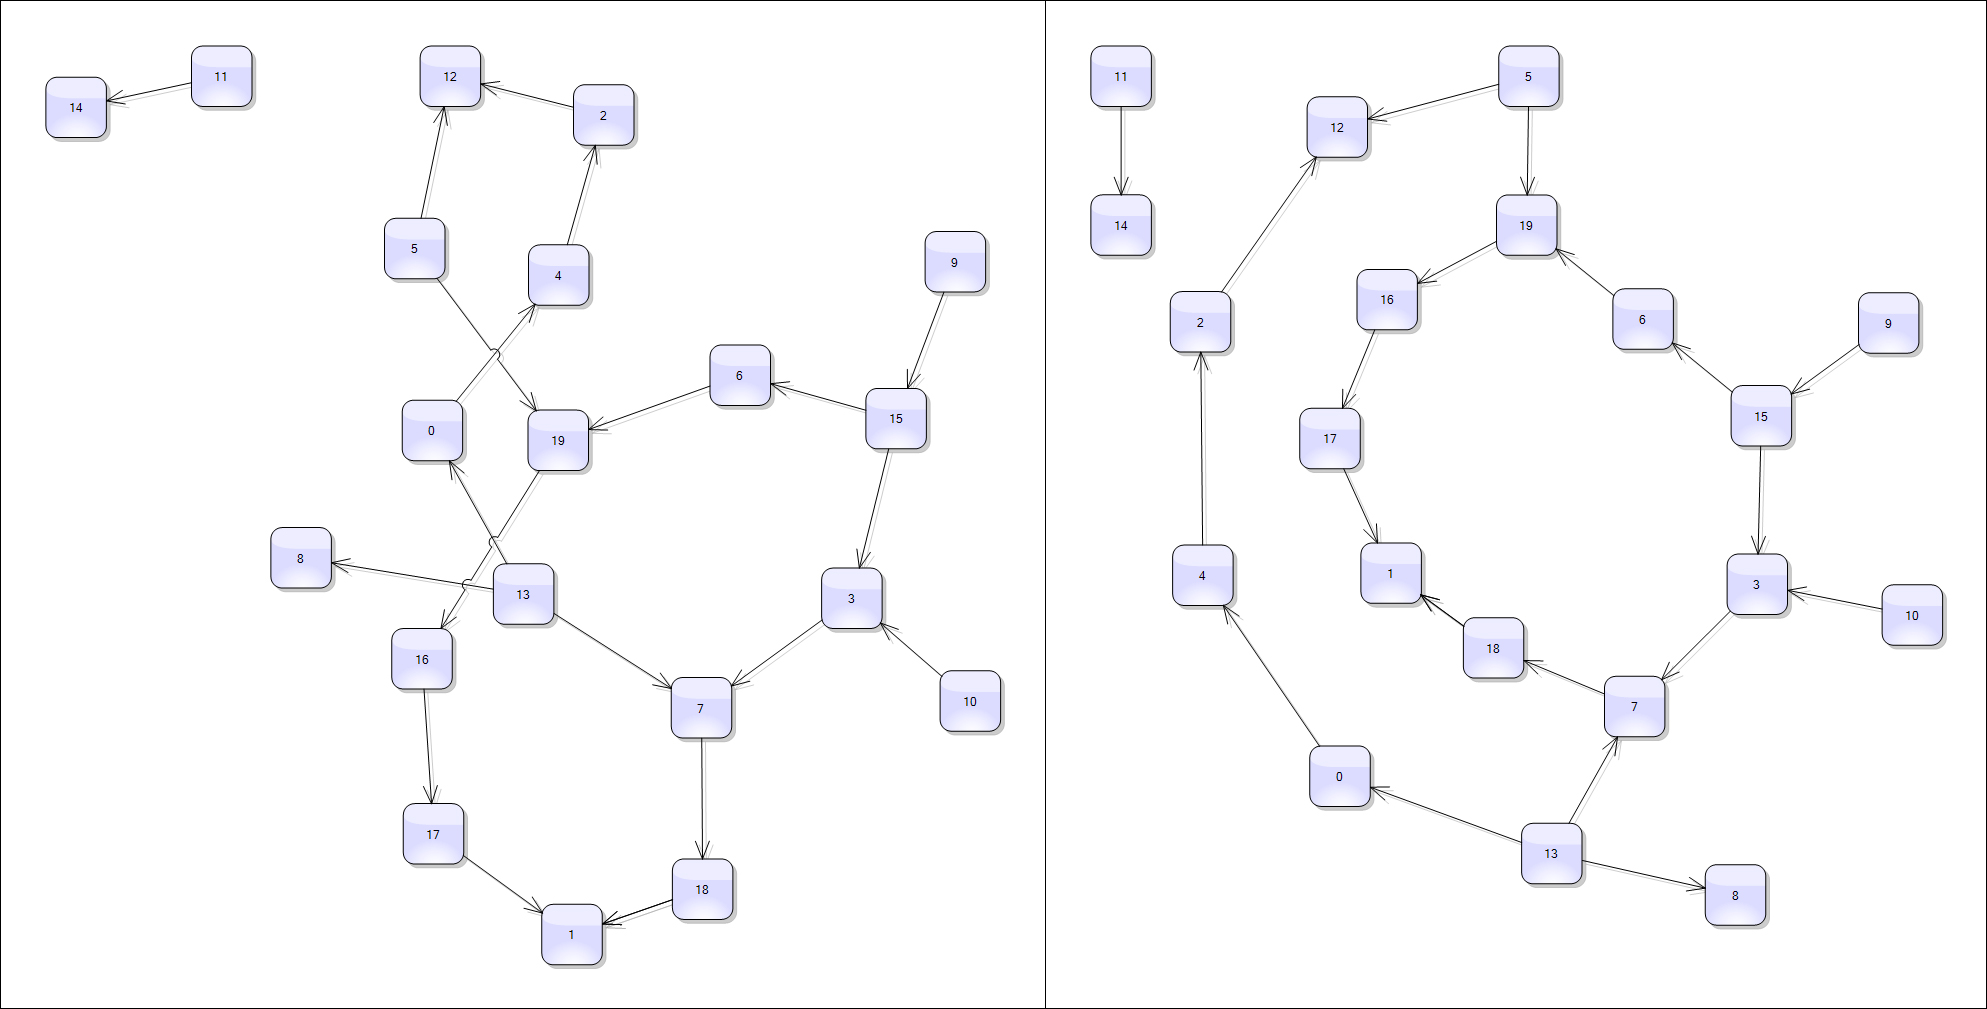
DecisionLayout arranges simple flowcharts consisting of decision boxes with up to three outgoing links per node and activity boxes with a single outgoing link per node. The nodes are arranged in columns and rows, whose distance depends on the HorizontalPadding and VerticalPadding property values. When links share the same row or column, they are placed at a distance specified via LinkPadding. The layout arranges nodes recursively starting from StartNode.
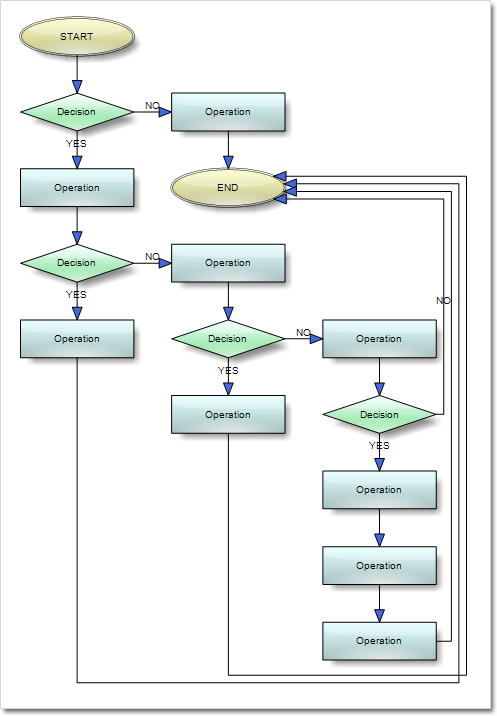
The decision flowchart layout.
Node list control
The NodeListView is a listbox control that can host any type of DiagramNode -derived objects. You can drag nodes from the NodeListView control onto the DiagramView canvas, and when you drop them a clone of the selected node is created at the mouse pointer position. NodeListView is supported in ImageMap and Canvas modes.
Resize multiple nodes
You can now resize multiple selected nodes simultaneously. To enable that, set the AllowMultipleResize property to true. Then you can drag a corner or side adjustment handle of any node to resize all nodes in the selection.
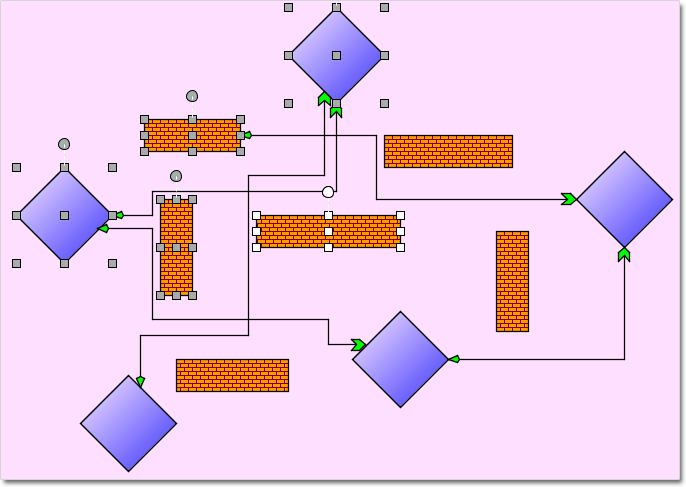
Resize of multiple nodes.
Canvas mode improvements
- You can now use undo and redo. Call setUndoEnabled on client side to start tracking changes. Call undo or redo methods to restore diagram state. Actions cannot be undone after postback.
- You can apply animations to diagram elements. You can use the Animation JavaScript class to animate values of various properties of nodes and links. Detailed overview is available in the Animations topic.
- Clipboard support; call the copyToClipboard, cutToClipboard and pasteFromClipboard methods to
copy or paste selected items.
- The swimlane grid is now rendered in Canvas mode.
- The magnifier tool is now supported in Canvas mode.
- ModificationStart, AutoResize and AutoScroll properties now work in Canvas mode.
- and much more – see the full list here.
Intellisense support
The package now includes a MindFusion.Diagramming-vsdoc.js file providing code completion information for the Canvas mode JavaScript API. To load it in Visual Studio, add a /// tag to the top of your script files. Use the static Diagram.findDiagram method instead of $find to let Visual Studio infer the type of returned Diagram objects correctly.
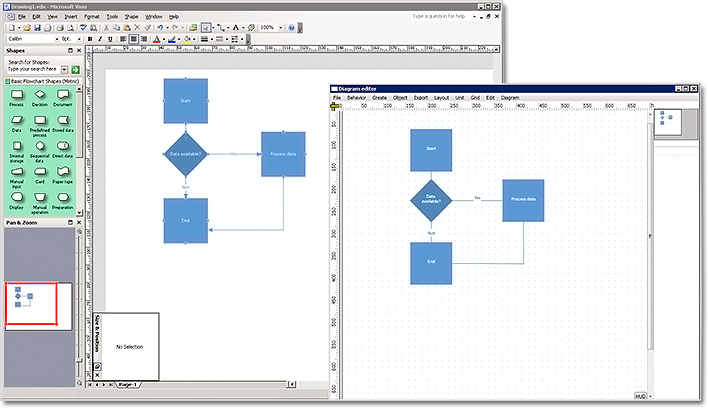
Export Visio 2013 files
The Visio2013Exporter class can export the content of Diagram and DiagramDocument objects to Visio 2013 VSDX files. In order to use it, you must first add a reference to the MindFusion.Diagramming.Export.Visio.dll assembly. Currently the exporter supports shapes from Visio basic stencil.
Visio2013Importer improvements
- The importer now supports Visio group shapes. Child shapes in groups are no longer lost when
importing, and their corresponding diagram nodes are attached to the corresponding group node.
- Visio NURBS curves are now imported as Bezier-style links.
- Fix for importing connectors with applied rotation transform.
- Shapes with a ‘hidden’ attribute in master definition are now imported as invisible items.
- And much more – read the list here.
Headers and footers in PDF
In PdfExporter you can now add headers and footers to exported pages. To specify their contents and font, set the HeaderFormat, HeaderFont, FooterFormat and FooterFont properties. Adding a %P placeholder to HeaderFormat or FooterFormat will render the current page number at its position.
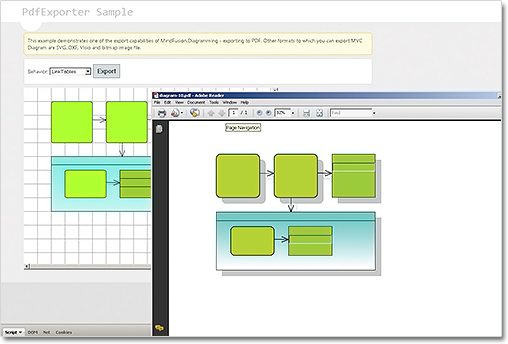
The PdfExporter
Miscellaneous
- OrthogonalLayout no longer ignores repeating links, and will now place them at a distance specified via RepeatingLinksPadding property.
- The Brush property of LinkLabel class lets you set background color for link labels.
- The ChangeUnit method sets a new MeasureUnit and rescales the coordinates of diagram items to
keep them the same size.
- Layout algorithms now automatically resize diagram’s Bounds if it’s not large enough to fit the
arranged content. To revert to old behavior and keep fixed Bounds size, set GrowToFit to false.
The trial version is available for download from this link:
Download MindFusion Pack for WebForms, 2014.R2
About MindFusion.WebForms Pack: A set of WebForms components that add great variety of features to your ASP.NET application with a few mouse clicks. The pack contains advanced components for diagramming, scheduling, charting and UI (Accordion, ColorPicker, TabControl, Window, WindowHost, DockControl, Button, Slideshow, Zoom and more). Each tool boasts easy to learn and use API and is quickly integrated into any web application that targets the ASP.NET platform. The controls support numerous options for styling, data import / export, user interaction and offer rich event set. There are plenty of samples and step-by-step tutorials as well detailed documentation.
Use the features page for each of the tools to find out more about its capabilities and the numerous ways it can boost your performance and speed up the development of your application:
- Diagramming for ASP.NET
- Scheduling features page
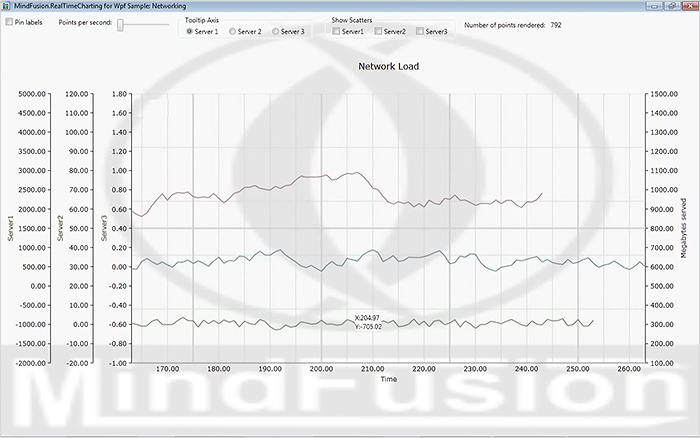
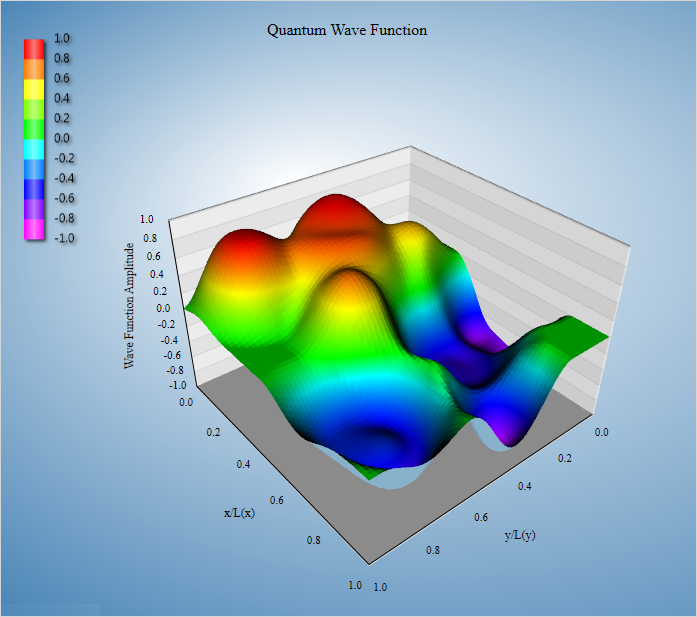
- Charting features page
- and UI (Accordion, ColorPicker, TabControl, Window, WindowHost, DockControl, Button, CheckBox, Radio, Slideshow, Zoom and many more).
Visit the buy page for details on the licensing scheme and prices. If you have questions please contact us. We shall be happy to assist you.