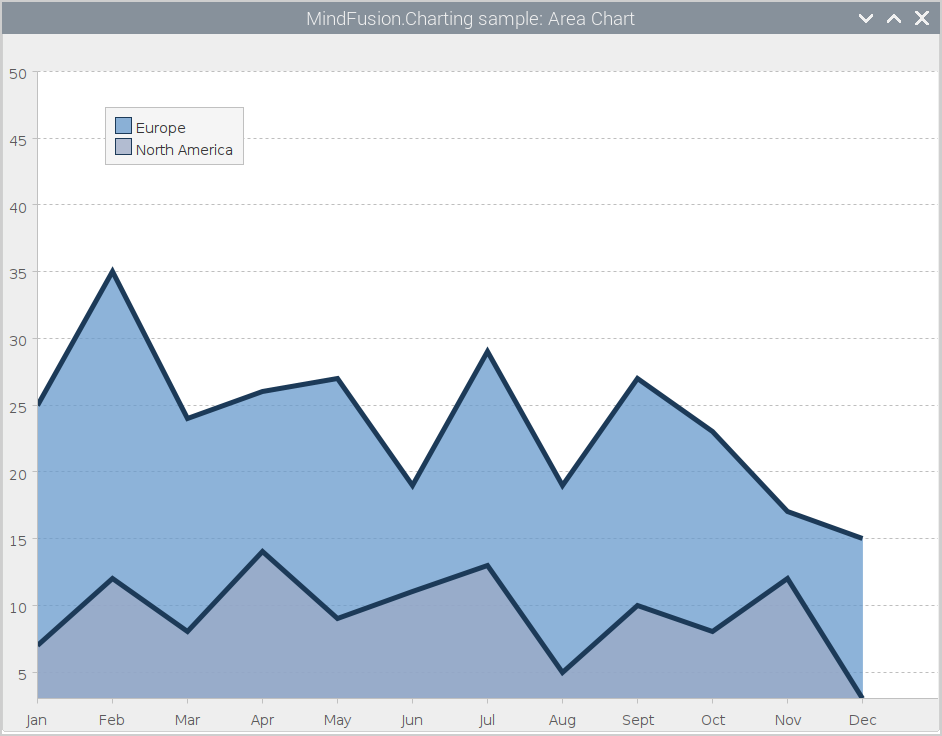
In this blog post we will build the chart that you see in the image below:
The next sections present you with a step-by-step guide how to build this quadratic equations chart from scratch.
In this blog post we will build the chart that you see in the image below:
The next sections present you with a step-by-step guide how to build this quadratic equations chart from scratch.
In this tutorial we demonstrate how to create a sample diagram and arrange it with the LayeredLayout. The diagram is generated with the Xamarin flowchart library. Here is a screenshot of the final application on an Android phone:
In this blog post we will demonstrate how to setup a Unix/Linux system to run a sample JavaScript diagram application under Electron.js. We use a Raspberry Pi computer which runs Raspberry Pi OS – the Debian-based OS optimized for the Raspberry Pi hardware.
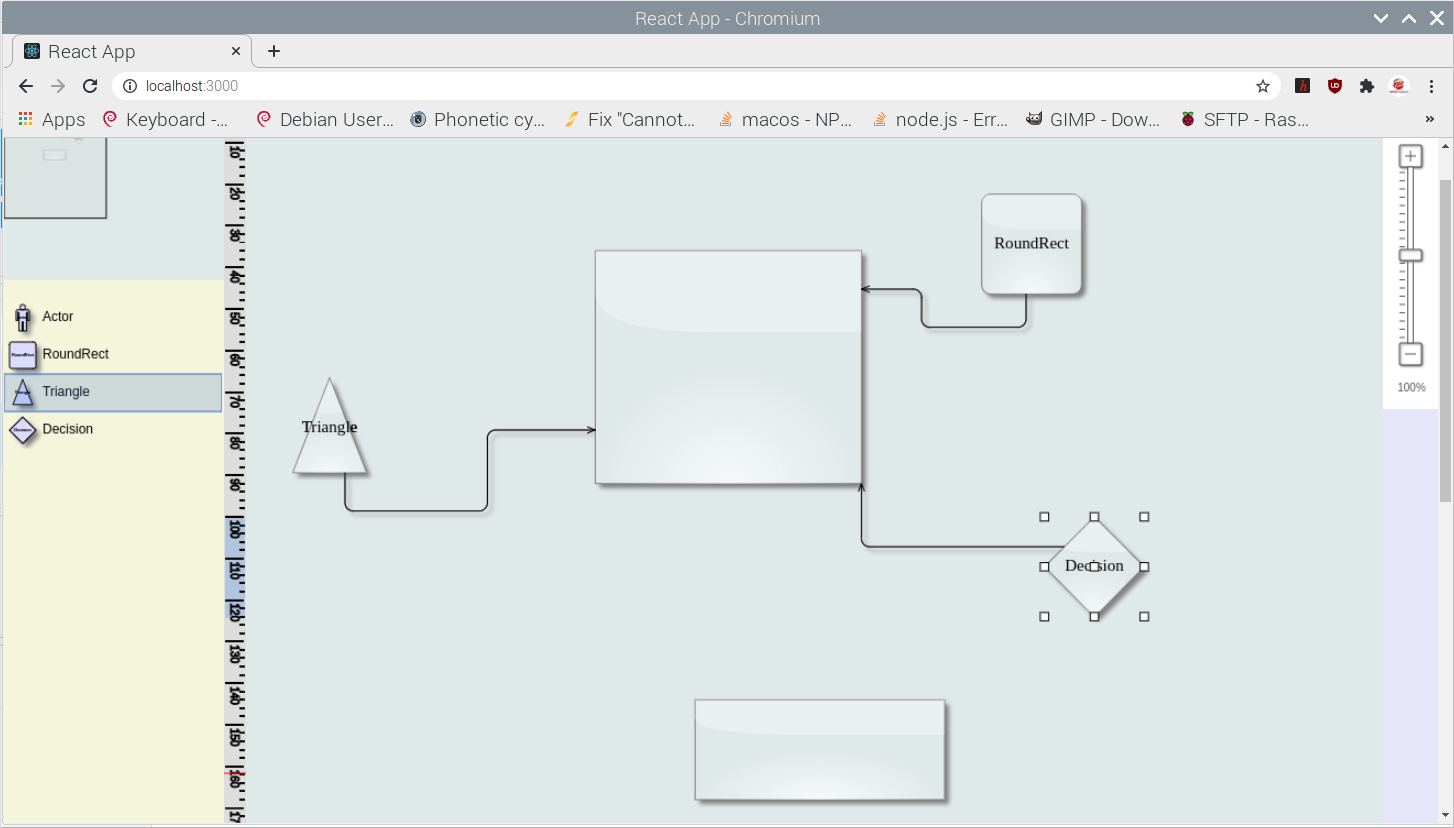
Here is how our test application looks like:
We will build a diagram where we will arrange the nodes in a hierarchical manner to visualize the chain of responsibility in a company. We use the JavaScript Diagramming library, the TreeLayout and custom AnchorPattern definitions for nodes. Here is the final result:
In this blog post we will look on how to build ControlNode -s with Mindusion Diagramming library for JavaScript. We will create a web page that creates a template for cooking recipes. Each recipe is a DiagramNode . Rows in the table with ingredients can be added or removed dynamically with buttons. When you click on the recipe image, a browse dialog appears and you can point to another one.
You can test the page yourself: