We have released Charting for Silverlight 1.2 with the following new features:
Styles and Themes
The appearance of each chart element – axis, legend, series – is defined by a style. Each ChartTheme is a collection of styles. Charting for Silverlight 1.2 lets you:
- create themes based on the appearance of an existing chart
- create themes with the ThemeEditor tool
- save themes to XML files
- load themes from XML files
- use a number of predefined themes.
You can read detailed instructions on how to save, load and edit themes in the “Working with Themes” tutorial.

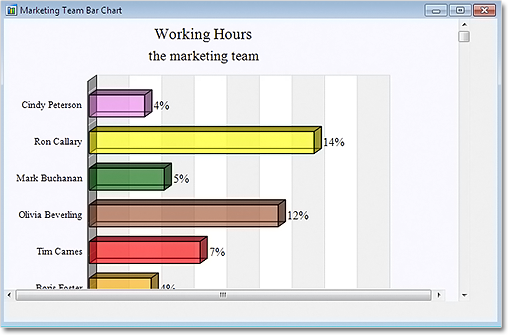
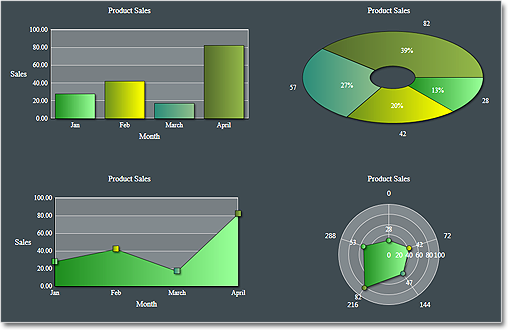
The green theme applied at a bar chart in Silverlight.
Better Design Time Support
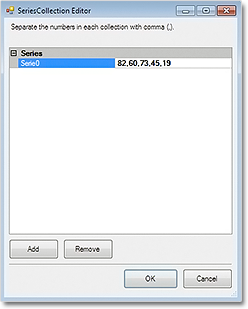
Charting for Silverlight lets you now edit all collection properties – like series, legends and brushes – in the property grid. In addition we have added converters that let you edit label and data collection in XAML.
Axis Intervals
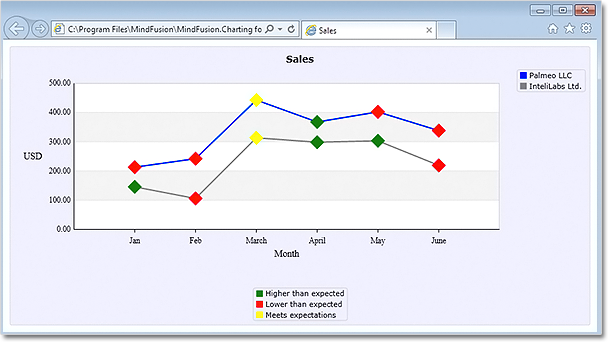
The new AxisSettings.IntervalCount property lets you specify the count of intervals at the numeric axis. When IntervalCount is set, the Interval property is not considered and the axis is calculated based on AxisSettings.Min, AxisSettings.Max and AxisSettings.IntervalCount.

A bar chart with two Y-axes.
API Changes
There are a number of changes in the control’s API mainly the type of some properties that were collections is changed to accommodate the new design-time features. Check the “What’s New in This Release” section in the control’s documentation for further details.
You can find out more about the new release at the news page in the Charting for Silverlight section on our forum. The trial version is available for download from here:
Charting for Silverlight 1.2 Trial Version Download
You are welcome to contact us with any questions, problems or inquiries about the control or any other of our products. You can use the discussion board, the help desk or the contact form. MindFusion has always put special emphasis on providing excellent customer support and we usually answer your questions within hours of receiving them.
About MindFusion.Charting for Silverlight: A programming component that combines powerful charting capabilities with a simple API and easy use. Among the features of the control are fully customizable grid, multiple legends, positive and negative values on all chart axes, second X and second Y axis, gauges and many more – read them here.
The control provides detailed documentation and many different samples that show how to customize it. It supports all major chart types – bar, line, radar and pie, as well different modifications of them – column, doughnut, polar, area charts etc. Licenses are counted per user, distribution is royalty free. Each license guarantees full technical support. The source code is also available.