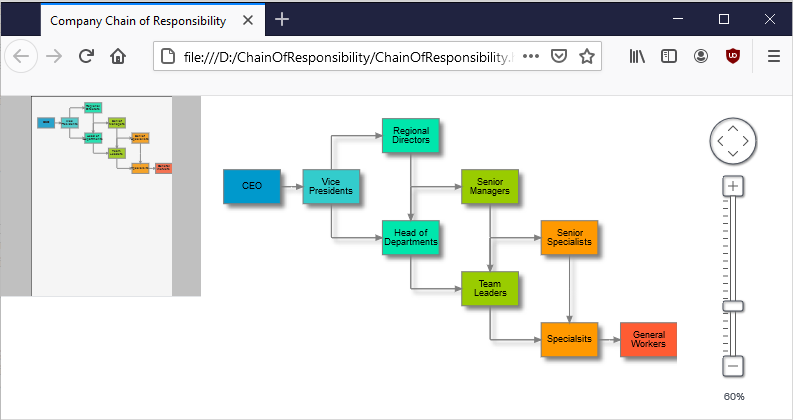
JavaScript Diagram Library, V2.8 Released

The new JavaScript library has been released with the following new features:

Fluent API

Builder objects with property setters and shortcut methods for font and brush creation add support for fluent programming style. Static With and instance init methods in DiagramItem, Style and Layout -derived classes return a builder instance that can be used to set up respective new or existing objects.

DiagramLink improvements

  • HeadStroke, HeadStrokeThickness and HeadStrokeDashStyle properties let you customize arrowhead strokes independently of line segments strokes.
  • The AllowSelfLoops property of Diagram class controls whether users are allowed to draw self-loop links.
  • The new Spline element of LinkShape enumeration draws links as interpolating splines that pass through all of their control points.
The new JS Diagram boasts improved DiagramLink-s.

The new JS Diagram boasts improved DiagramLink-s.

Miscellaneous

A trial version is available for download here:

Download MindFusion Diagram Library for JavaScript, V2.8

About Diagramming for JavaScript Library: Written 100% in JavaScript, this tool is a dynamic, browser based visualization library that uses HTML5 Canvas to draw impressive diagrams, schemes, flowcharts, trees and many more. It is browser independent, easy to use and allows you to integrate interactive diagrams for JavaScript and HTML into any web application. This MindFusion graphing library supports a variety of predefined node shapes, customizable links, rich event set and many appearance options.

The user interaction model includes resizing / moving / selecting and modifying any diagram element. The library boasts an elegant API, which is documented in details, numerous step-by-step guides and tutorials. The Diagramming API also provides TypeScript definitions. Various samples are provided to let you learn quickly how to use the most important features of the library – check them here. The JavaScript diagram builder is not only the perfect choice for creating any type of diagram in the browser – it can also arrange it the way you wish with a mouse click using one of its automatic graph layout algorithms. For more details about the features of the component, please visit the Diagram for JavaScript page.

Lane diagram in JavaScript

In this post we will show how to use the JavaScript diagram library to create a lane diagram. The complete example is available here:

Lanes.zip

Create a new HTML page and add references to the jQuery library and to the MindFusion.Diagramming library:

<script src="jquery.min.js" type="text/javascript"></script>
<script src="MindFusion.Common.js" type="text/javascript"></script>
<script src="MindFusion.Diagramming.js" type="text/javascript"></script>

Create shortcuts to some classes from the diagram model:

var Events = MindFusion.Diagramming.Events;
var Diagram = MindFusion.Diagramming.Diagram;
var AnchorPattern = MindFusion.Diagramming.AnchorPattern;
var AnchorPoint = MindFusion.Diagramming.AnchorPoint;
var Alignment = MindFusion.Diagramming.Alignment;
var MarkStyle = MindFusion.Diagramming.MarkStyle;
var Style = MindFusion.Diagramming.Style;
var Theme = MindFusion.Diagramming.Theme;
var LinkShape = MindFusion.Diagramming.LinkShape;
var Shape = MindFusion.Diagramming.Shape;
var LaneGrid = MindFusion.Diagramming.Lanes.Grid;
var LaneHeader = MindFusion.Diagramming.Lanes.Header;
var LaneStyle = MindFusion.Diagramming.Lanes.Style;
var Rect = MindFusion.Drawing.Rect;
var Point = MindFusion.Drawing.Point;
var HandlesStyle = MindFusion.Diagramming.HandlesStyle;

Next, add a canvas the the page and create a diagram from it by using the Diagram.create() method:

diagram = Diagram.create($("#diagram")[0]);

You can obtain a reference to the diagram lane grid by calling the Diagram.getLaneGrid() method. You can use the returned object to add rows and columns to the grid and customize its appearance. Finally, to display the grid, call Diagram.setShowLaneGrid(). The customization is omitted here for brevity, but the full code is available in the associated sample project.

The lane grid implies some restrictions to the node and links inside of it. For example, the nodes can be moved only inside the row lanes of the grid. To enforce those restrictions, we will handle several diagram events:

diagram.addEventListener(Events.nodeCreated, onNodeCreated);
diagram.addEventListener(Events.nodeModified, onNodeModified);
diagram.addEventListener(Events.linkCreated, onLinkCreated);

In the nodeCreated event handler, get the gird cell at the top left of the node’s bounding rectangle and align the node to this cell:

function onNodeCreated(sender, e) {
    var node = e.getNode();
    node.setAnchorPattern(pattern);
    node.setHandlesStyle(HandlesStyle.HatchHandles3);

    // Place the box within the grid
    var bounds = node.getBounds();
    var topLeft = new Point(bounds.x, bounds.y);

    var cellBoundsReciever = {};
    if (!grid.getCellFromPoint(topLeft, cellBoundsReciever))
        return;
    var cellBounds = cellBoundsReciever.cellBounds;

    var pixel = 1;

    bounds.y = cellBounds.y + pixel;
    bounds.height = cellBounds.height - 2 * pixel;
    node.setBounds(bounds);
}

Similar rules can be applied to the links in the linkCreated event handler.

The following image illustrates the grid in action:

JavaScript Swimlane Diagram

For more information on MindFusion JavaScript diagram library, see its help reference and overview page.

Enjoy!

Class inheritance diagram in JavaScript

In this post we will show how to use the JavaScript diagram library to generate a class inheritance diagram. The complete example is available here:

InheritanceDiagram.zip

and a live version here:

http://mindfusion.eu/demos/jsdiagram/Inheritance.html

Let’s start by creating shortcuts to some classes from the diagram model:

var Diagram = MindFusion.Diagramming.Diagram;

var DiagramItem = MindFusion.Diagramming.DiagramItem;
var DiagramLink = MindFusion.Diagramming.DiagramLink;
var DiagramNode = MindFusion.Diagramming.DiagramNode;
var ShapeNode = MindFusion.Diagramming.ShapeNode;
var TableNode = MindFusion.Diagramming.TableNode;
var ContainerNode = MindFusion.Diagramming.ContainerNode;
var FreeFormNode = MindFusion.Diagramming.FreeFormNode;
var SvgNode = MindFusion.Diagramming.SvgNode;

var ScrollBar = MindFusion.Diagramming.ScrollBar;
var Rect = MindFusion.Drawing.Rect;
var Font = MindFusion.Drawing.Font;
var TreeLayout = MindFusion.Graphs.TreeLayout;

Next, create a function that takes a Diagram instance and a list of class names as parameters. It will create a TableNode for each class. Each property of the class prototype is listed in a TableNode cell. If the getBaseType function detects a class inherits another one from the list, we’ll create a link between their nodes. Finally, the diagram is arranged using the TreeLayout algorithm.

function createClassDiagram(diagram, classes)
{
    var classConstructors = [];

    // create a table node for each class
    for (var i = 0; i < classes.length; i++)
    {
        var className = classes[i];
        var node = diagram.getFactory().createTableNode(20, 20, 42, 42);
        node.redimTable(1, 0);
        node.setText(className);
        node.setBrush("white");
        node.setCaptionBackBrush("lightgray");
        node.setCaptionFont(
            new Font("sans-serif", 3, true /*bold*/, true /*italic*/));
        node.setScrollable(true);

        var ctor = eval(className);
        for (var property in ctor.prototype)
        {
            node.addRow();
            node.getCell(0, node.rows.length - 1).setText(property);
        }
        classConstructors.push(ctor);
        ctor.classNode = node;
    }
	
    // create a diagram link for each prototype inheritance
    classConstructors.forEach(function(ctor)
    {
        var base = getBaseType(ctor);
        if (base && base.classNode)
        {
            var link = diagram.factory.createDiagramLink(
                base.classNode,
                ctor.classNode);
            link.setHeadShape(null);
            link.setBaseShape("Triangle");
            link.setBaseShapeSize(3);
        }
    });

    // arrange as a tree
    var treeLayout = new TreeLayout();
    treeLayout.linkType = MindFusion.Graphs.TreeLayoutLinkType.Cascading;
    diagram.arrange(treeLayout);
}

The getBaseType implementation checks if a class was registered as a base for the argument using MindFusion.registerClass method or the common prototype inheritance pattern.

function getBaseType(ctor)
{
    // if class registered using MindFusion.registerClass
    if (ctor.__baseType)
        return ctor.__baseType;

    // if  prototypical inheritance with Child.prototype = new Parent()
    if (ctor.prototype && ctor.prototype.constructor != ctor)
        return ctor.prototype.constructor;
	
    return null;
}

The ready handler creates a Diagram instance binding it to a #diagram canvas element. It then calls createClassDiagram with a list of DiagramItem -derived classes as argument:

$(document).ready(function ()
{
    TableNode.prototype.useScrollBars = true;
    ScrollBar.prototype.background = "Lavender";
    ScrollBar.prototype.foreground = "DarkGray";

    // create a Diagram component that wraps the "diagram" canvas
    var diagram = Diagram.create($("#diagram")[0]);

    createClassDiagram(diagram,
    [
        "DiagramItem",
        "DiagramLink",
        "DiagramNode",
        "ShapeNode",
        "TableNode",
        "ContainerNode",
        "FreeFormNode",
        "SvgNode"
    ]);
});

If you run the sample now, you should see this nice visualization of MindFusion classes 🙂

JavaScript class inheritance diagram

For more information on MindFusion JavaScript diagram library, see its help reference and overview page.

Enjoy!

Design custom shapes with WPF Diagram

Watch here the video for this tutorial.

This tutorial will run you through the process of creating custom WPF diagram shapes using the built-in Shape Designer. Keep in mind that the Designer is intended as a sample and is limited in terms of functionality. The designer is available inside the installation of MindFusion.Diagramming for WPF but is also included in this tutorial for convenience. For the purposes of this tutorial, we will create an ‘AND Gate’ circuit diagram shape as illustrated by the following image:

Circuit shapes

Run the Shape Designer application through the ShapeDesign.exe. The Shape Designer opens up with a single rectangular shape ready to be modified.

Diagramming WPF Circuit Shapes 1

The Shape Designer does not currently support shape renaming (remember, it’s just a sample), therefore create a new shape through the Shapes menu and name it ‘AndGate’.

Diagramming WPF Circuit Shapes 2

Select the newly created shape from the list on the left. In the editor select the right segment of the shape’s rectangle and press the DEL button on the keyboard. This will delete the segment and make the shape triangular.

Diagramming WPF Circuit Shapes 3

Adjust the end points of the shape segments so that it gets deflated on both sides. To adjust a segment, hover it with the mouse (so that its adjustment handles appear), then drag the handles.

Diagramming WPF Circuit Shapes 4

Select the arc primitive from the list on the right side of the screen. Drag this primitive over the top segment of the shape (until it gets highlighted in red) then drop.

Diagramming WPF Circuit Shapes 5

This will replace the line segment with an arc. Repeat the same process for the bottom segment of the shape.

Diagramming WPF Circuit Shapes 6

Adjust the middle point of both segments so that the shape looks protruded. Then drag three line primitives from the list on the right to the editor pane. Be careful not to drop the primitives over existing elements because this will replace the elements.

Diagramming WPF Circuit Shapes 7

Align the newly created line primitives with the existing shape.

Diagramming WPF Circuit Shapes 8

From the list with anchor points at the right side of the application, drag two anchor points from the first kind (input only) and one anchor point from the second kind (output only) and drop them inside the editor. Align the anchor points with the end points of the line segments created in the previous step.

Diagramming WPF Circuit Shapes 9

This will conclude the creation of the ‘AND Gate’ shape. You can test the shape in the preview diagram at the bottom of the screen.

Diagramming WPF Circuit Shapes 10

Save the shape library. Using the same approach, recreate the other circuit shapes from the image above. The following screenshot illustrates the complete library.

Diagramming WPF Circuit Shapes 11

The shape designer along with the shape library containing the circuit shapes can be downloaded from the link below:

Design Circuit Shapes

You are welcome to ask any questions about the WpfDiagram control at MindFusion discussion board or per e-mail at support@mindfusion.eu.

Click here here to visit the official page of the control.

We hope you find this tutorial useful and thank you for your interest in MindFusion developer tools.

Node.js diagram module

MindFusion.Diagramming for JavaScript is now also available as a Node.js module, and you can use the diagram API you know and love in server code 🙂 A sample server application and the module script are available here:

diagram_nodejs.zip

For example, you can submit to server a diagram drawn interactively by the user and examine its contents there by iterating over the nodes and links members of the Diagram class:

// on client side
$.ajax(
{
	type: "post",
	url: "http://localhost:1234/diagram", 
	contentType: "application/json",
	data: diagram.toJson(),
	success: function(data)
	{
		console.log('success');
	},
	error: function(jqXHR, textStatus, err)
	{
		console.log(err);
	}
});

// on server side
app.post('/diagram', function(req, res)
{
    // won't be required in final release
    var dummyCanvas = { parentNode:{} };

    // create Diagram instance
    var diagram = new Diagram(dummyCanvas);

    // load diagram elements drawn by user
    diagram.fromJson(req.rawBody);

    // examine diagram contents
    console.log(diagram.nodes.length + " nodes");
    console.log(diagram.links.length + " links");
    diagram.nodes.forEach(function (node, index)
    {
        console.log("node " + index + ": " + node.getText());
    });

    // send some response
    res.send('ok');
});

Or you could build the diagram on server side and send it to the browser to render in client-side Diagram control:

// on server side
app.get('/diagram', function(req, res)
{
    // won't be required in final release
    var dummyCanvas = { parentNode:{} };

    // create Diagram instance
    var diagram = new Diagram(dummyCanvas);

    // create some diagram items
    var node1 = diagram.getFactory().createShapeNode(10, 10, 40, 30);
    var node2 = diagram.getFactory().createShapeNode(60, 10, 40, 30);
    var link = diagram.getFactory().createDiagramLink(node1, node2);

    // set nodes' content
    node1.setText("node.js");
    node1.setBrush("orange");
    node2.setText("hello there");

    // send diagram json
    res.send(
        diagram.toJson());
});

// on client side
$.ajax(
{
	type: "get",
	url: "http://localhost:1234/diagram", 
	success: function(data)
	{
		diagram.fromJson(data);
	},
	error: function(jqXHR, textStatus, err)
	{
		console.log(err);
	}
});

To run the sample Node.js application, run “node server.js” from command line and open http://localhost:1234/client.html in your browser. Draw some nodes and links, edit their text and click Post to see them enumerated in Node’s console. Clicking the Get button will show this diagram built on server side:

diagram built in node.js

For more information on MindFusion’s JavaScript Diagram API, see MindFusion.Diagramming online help

Enjoy!