Running JavaScript Diagram Applications with Electron.js

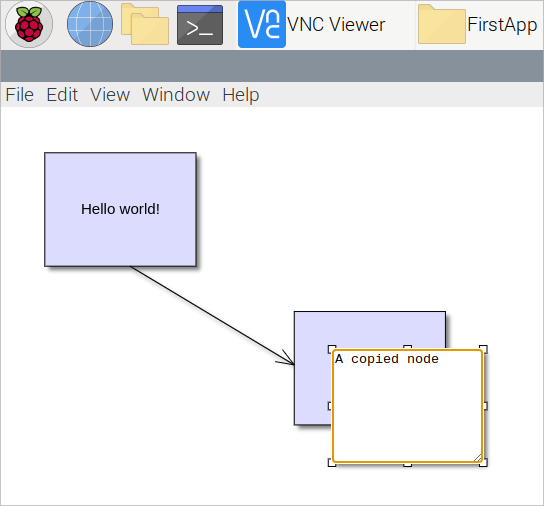
In this blog post we will demonstrate how to setup a Unix/Linux system to run a sample JavaScript diagram application under Electron.js. We use a Raspberry Pi computer which runs Raspberry Pi OS – the Debian-based OS optimized for the Raspberry Pi hardware.

Here is how our test application looks like:

Continue reading

Organization Services Chart with the JavaScript Diagram Library

In this blog post we will use MindFusion JavaScript Diagram library to build an application that allows the users to create a diagram with nodes that hold icons and text. We have used this online diagram application to build an infogram for the services portfolio of an imaginary company. However, you can replace the icons and use it as a tool to build diagrams of whatever domain is of interest to you.

In the sample diagram we use SVG images from Google’s material design icons set. You can download them from https://github.com/google/material-design-icons.
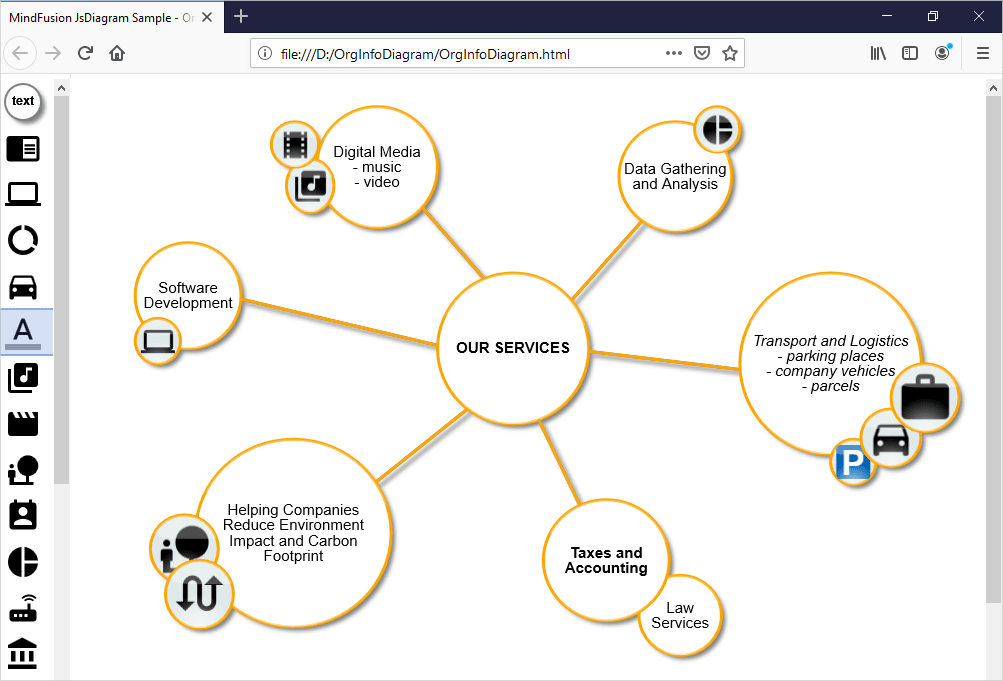

Our sample application uses a Diagram and a NodeListView controls – both of them part of JsDiagram.

I. General Settings

We need to add two HTML Canvas elements to the web page where the sample application will be. One is for the NodeListView and the other is for the Diagram

<div style="width: 70px; height: 100%; overflow-y: auto; overflow-x: hidden; position: absolute; top: 5px; left: 0px; right: 0px; bottom: 0px;">
    <canvas id="nodeList" width="200"></canvas>
</div>
...........................
<div style="position: absolute; left: 70px; top: 5px; right: 0px; bottom: 0px; overflow: auto;">
    <canvas id="diagram" width="2100" height="2100">
        This page requires a browser that supports HTML 5 Canvas element.
    </canvas>
</div>

We place the two Canvas elements using CSS next to each other. The NodeListView is in a long and narrow Canvas and next to it is the Diagram Canvas, which has a big size of 211 pixels. It is important that we provide the two Canvases with id-s: we will refer to them later in the JavaScript code using these id-s.

Then we add references to the two JavaScript files that we use from the Diagram library – MindFusion.Diagramming and MindFusion.Common:

<script src="Scripts/MindFusion.Common.js" type="text/javascript"></script>
<script src="Scripts/MindFusion.Diagramming.js" type="text/javascript"></script>
<script src="OrgInfoDiagram.js" type="text/javascript"></script>

The last JavaScript file that we reference is OrgInfoDiagram and there we keep the code for our application.

II. The Diagram

We create the Diagram object by using the reference to the Canvas that will render it:

// create a Diagram component that wraps the "diagram" canvas
diagram = Diagram.create(document.getElementById("diagram"));

Then we use an instance of the Style class to create a style that will determine how newly created –DiagramNode -s are styled:

//styling
var shapeNodeStyle = new Style();
shapeNodeStyle.setBrush({ type: 'SolidBrush', color: '#e0e9e9' });
shapeNodeStyle.setStroke("Orange");
shapeNodeStyle.setFontName("Verdana");
shapeNodeStyle.setFontSize(9);   
shapeNodeStyle.setNodeEffects([new GlassEffect()]);

The Style instance applies GlassEffect on the new nodes and places a thick orange border around them. We also allow users to edit diagram nodes by calling setAllowInplaceEdit .

diagram.setStyle(shapeNodeStyle);
diagram.setAllowInplaceEdit(true);

III. The NodeListView

The NodeListView control can hold both text and image nodes. We create it the same way we created the Diagram : by using the id of its Canvas element:

// create a NodeListView component that wraps the "nodeList" canvas
var nodeList = MindFusion.Diagramming.NodeListView.create(document.getElementById("nodeList"));
nodeList.setTargetView(document.getElementById("diagram"));
nodeList.setIconSize(new Size(36, 36));
nodeList.setDefaultNodeSize (new Size(18, 18));

It is important that we set the target of the NodeListView – this is the Canvas, where the newly created DiagramNode will be rendered. We also set the size of the icons in the NodeListView and the size that newly created nodes will have. For this we use the setIconSize and setDefaultNodeSize methods respectively.

We create the nodes for the NodeListView in a special method called initNodeList:

function initNodeList(nodeList, diagram)
{
    var node = new ShapeNode(diagram);
    node.setText("text");
    node.setShape("Ellipse");
    node.setPen("Gray");		
    node.setBrush("White");
    node.setBounds(new Rect(0, 0, 48, 48));
    node.setEnableStyledText(true);
    node.setFont(new Font("sans-serif", 12, true));
    node.setStrokeThickness(2);
    nodeList.addNode(node);
    .......................................

The first ShapeNode that we create is a standard text node with the difference that we enable styled text for it: that means the user can enter bold, italic or underline text using the standard HTML tags <b>, <i>, <u>. We specify this with the method setEnableStyledText . We also add the node to the NodeListView that we have provided to the method.

In order to create nodes with SVG images, we need to create instances of the SvgNode class:

// add some nodes to the NodeListView
var svgImages = ["call", "reader", "computer", "data", "car", "text", "music", "movie", "nature", "calendar", "chart", "router",  "account", "alarm", "announcement", "book", "calls", "copyright", "event", "grade", "group_work", "info", "key", "list", "payment", "phone", "shop", "sign", "textsms", "theaters", "work"];
for (var i = 1; i <= svgImages.length; ++i)
{
    node = new MindFusion.Diagramming.SvgNode(new Rect(0, i * 48, 48, 48));
    node.setTransparent(true);
var content = new SvgContent(); content.parse(svgImages[i] + ".svg"); node.setContent(content);
nodeList.addNode(node); }

We have copied the desired icons in the directory of the application and we have listed their names in a list. Then we cycle through all members of the list and create instances of the SvgNode class. We set their background to be transparent and we render the images thanks to the SvgContent class. Finally we also add the newly created SvgNode -s to the node list.

We call the initNodeList method providing the nodeList and diagram instances:

initNodeList(nodeList, diagram);

IV. Events

Though the code so far is enough to provide the desired functionality of our application, we want to customize the newly created diagram nodes and links. This can be achieved through events. We handle two of them onNodeCreated and LinkCreated.

diagram.addEventListener(Events.nodeCreated, onNodeCreated);
diagram.addEventListener(Events.linkCreated, onLinkCreated);

In the NodeCreated event handler we get the ShapeNode that is being created and make its shape to a round one with the setShape method. We assign to it a thick orange border and add some padding to the images – in case it is an SvgNode:

function onNodeCreated(sender, args)
{
    var node = args.getNode();
    node.setTransparent(false);
    node.setShape("Ellipse");
    node.setStroke("orange");
    node.setStrokeThickness(3);
    node.setFont(new Font("sans-serif", 4));
    node.setImagePadding(new Thickness(1.5, 1.5, 1.5, 1.5));
}

The linkCreated event handler applies some styling, but to newly created DiagramLink instances”

function onLinkCreated(sender, e)
{
    var link = e.getLink();
    link.setBaseShape(null);
    link.setHeadShape(null);
    link.setStrokeThickness(3.0);
}

We remove the default base and head shapes of the diagram links and leave the connectors to be just straight lines. We also draw them with a thick orange pen.

And these were the last lines of code that we had to add to make the application complete. You can download the source code, together with all all Diagramming libraries used from this link:

Download Organigram Application in JavaScript Source Code

You can use MindFusion Diagramming for JavaScript forum to post your questions, comments and recommendations about this sample or the Js Diagram library.

About Diagramming for JavaScript: This native JavaScript library provides developers with the ability to create and customize any type of diagram, decision tree, flowchart, class hierarchy, graph, genealogy tree and more. The control offers rich event set, numerous customization options, animations, graph operations, styling and themes. You have more than 100 predefined nodes, table nodes and more than 15 automatic layout algorithms. Learn more about Diagramming for JavaScript at https://mindfusion.eu/javascript-diagram.html.
Different-size Icons in the Js Diagram NodeListView

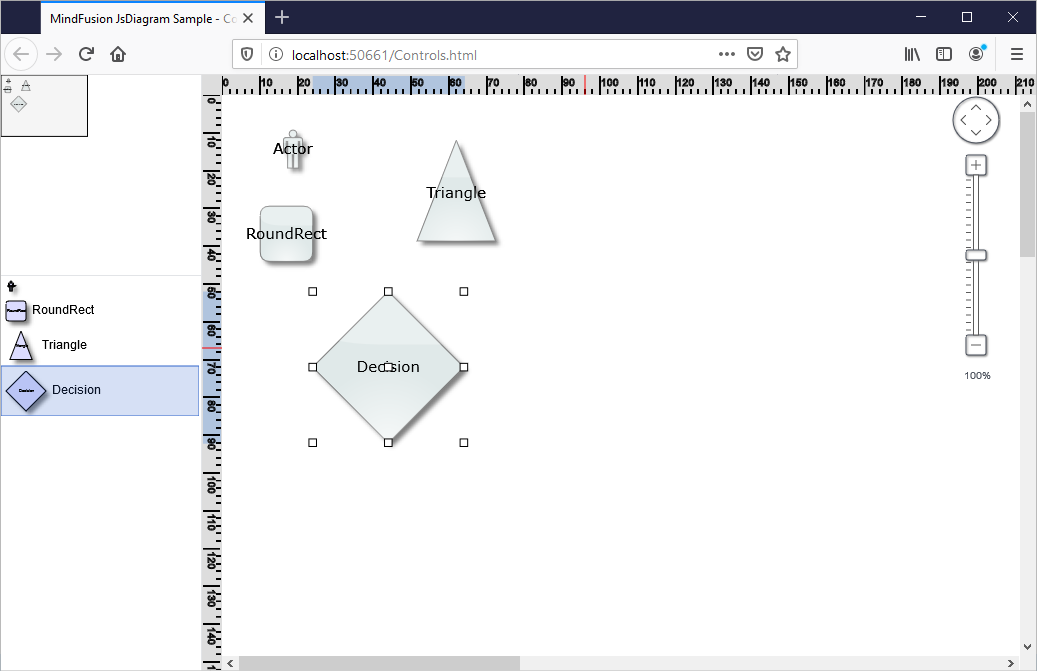
In this blog post we will learn how to add a NodeListView control to a Diagram and how to set its ShapeNode -s to a different size. When ShapeNode -s are dragged from the NodeListView the instances that will be created are proprtional in size to the size of the ShapeNode that was dragged. Here is a screenshot of the final application:

I. General Settings

We create an HTML page and add to it references to the MindFusion JavaScript files that represent the diagramming library:

<script src="MindFusion.Common.js" type="text/javascript"></script>
<script src="MindFusion.Diagramming.js" type="text/javascript"></script>
<script src="Controls.js" type="text/javascript"></script>

The last reference is to the Controls JavaScript file, where the code for the application is located.

Then we create two Canvas-es: one is for the NodeListView and the other is for the Diagram The NodeListView component is bound to the canvas element below:

<div style="width: 200px; height: 100%; overflow-y: auto; overflow-x: hidden; position: absolute; top: 201px; left: 0px; right: 0px; bottom: 0px;">
    <canvas id="nodeList" width="200"></canvas>
</div>
......
<!-- The Diagram component is bound to the canvas element below -->
<div style="position: absolute; left: 0px; top: 0px; right: 0px; bottom: 0px; overflow: auto;"> <canvas id="diagram" width="2100" height="2100">
This page requires a browser that supports HTML 5 Canvas element.
</canvas>
</div>

Both the Diagram and NodeListView controls require Canvas elements to render themselves onto.

II. Initializing the Controls

We create the Diagram using the id that we’ve provided to its Canvas in the web page:

// create a Diagram component that wraps the "diagram" canvas
diagram = Diagram.create(document.getElementById("diagram"));
diagram.setBounds(new MindFusion.Drawing.Rect(0, 0, 500, 500));

We set a bigger size to the diagram in order to make it fill the web page.

We create the NodeListView instance the same way we created the diagram:

// create a NodeListView component that wraps the "nodeList" canvas
var nodeList = MindFusion.Diagramming.NodeListView.create(document.getElementById("nodeList"));
nodeList.setTargetView(document.getElementById("diagram"));

Now we need to add the settings that will make the ShapeNode -s different in size when rendered onto the list:

nodeList.setIconSize(null);

The setIconSize method is used to specify the default size of nodes in the NodeListView When we set the size to null, the control draws each node in the NodeListView with the size that was assigned to it:

function initNodeList(nodeList, diagram)
{
    // add some nodes to the NodeListView
    var shapes = ["Actor", "RoundRect", "Triangle", "Decision"];
    for (var i = 0; i < shapes.length; ++i)
    {
        var node = new MindFusion.Diagramming.ShapeNode(diagram);
        node.setText(shapes[i]);
        node.setShape(shapes[i]);
        node.setBounds(new MindFusion.Drawing.Rect(0, 0, (i+1)*10, (i+1)*10));
        nodeList.addNode(node, shapes[i]);
    }
}

Here we increase the size of wach ShapeNode with 10 points on each itereation. This makes the icons with various size but does not create them with different size when dropped on the diagram. In order to do this we must set:

nodeList.setDefaultNodeSize (null);

setDefaultNodeSize specifies the size of those nodes that are created when a ShapeNode is dropped on the Diagram area. By setting this size to null we tell the control to read the size of the new ShapeNode from the instance in the NodeListView control.

With that our sample is ready. You can download the source code from this link:

JavaScript NodeListView with Various Size Nodes: Download Sample

About Diagramming for JavaScript: This native JavaScript library provides developers with the ability to create and customize any type of diagram, decision tree, flowchart, class hierarchy, graph, genealogy tree and more. The control offers rich event set, numerous customization options, animations, graph operations, styling and themes. You have more than 100 predefined nodes, table nodes and more than 15 automatic layout algorithms. Learn more about Diagramming for JavaScript at https://mindfusion.eu/javascript-diagram.html.
Collaborative drawing with MindFusion.Diagramming and SignalR

In this post we’ll show how to use the ASP.NET MVC diagram library and SignalR to implement collaborative drawing of diagrams. This can be useful in visual planning tools where users work together on a task, such as project management or mind-mapping applications.

The complete sample project is available here –
CollabMindMap.zip

Start by creating an ASP.NET MVC application in Visual Studio. Open Tools -> Library Package Manager -> Package Manager Console and install the MindFusion.Diagramming.Mvc package –

Install-Package MindFusion.Diagramming.Mvc 

While we are there, also install the SignalR package –

install-package Microsoft.AspNet.SignalR

From the project’s context menu, Add submenu, select OWIN startup class and add SignalR to the OWIN pipeline by calling –

app.MapSignalR();

Now lets add a diagram view to the home page at Views/Home/Index.cshtml, load the necessary script files and wire up diagram event handlers that will send change notifications to the hub –

@using MindFusion.Diagramming
@using MindFusion.Diagramming.Mvc

@{
    var diagView = new DiagramView("diagramView")
        .NodeCreatedScript("onNodeCreated")
        .NodeModifiedScript("onNodeModified")
        .NodeTextEditedScript("onNodeTextEdited")
        .LinkCreatedScript("onLinkCreated")
        .LinkModifiedScript("onLinkModified")
        .LinkTextEditedScript("onLinkTextEdited")
        .ControlLoadedScript("onDiagramLoaded")
        .SetAllowInplaceEdit(true);

    diagView.Diagram.DefaultShape = Shapes.Ellipse;
}

@Html.DiagramView(diagView, new { style = "width:700px; height:600px;" })

@section scripts
{
    @Scripts.Render("~/Scripts/jquery.signalR-2.0.0.js")
    @Scripts.Render("~/Scripts/MindMap.js")
    @Scripts.Render("~/signalr/hubs")
}

The hub will synchronize operations done on the diagram by one client by sending a notification to all other connected clients. From the project context menu add a SignalR hub class, naming it DiagramHub. The model class we’ll use to describe node changes looks like this –

public class NodeModel
{
    [JsonProperty("x")]
    public double X { get; set; }

    [JsonProperty("y")]
    public double Y { get; set; }

    [JsonProperty("width")]
    public double Width { get; set; }

    [JsonProperty("height")]
    public double Height { get; set; }

    [JsonProperty("id")]
    public string Id { get; set; }

    [JsonProperty("text")]
    public string Text { get; set; }
}

Add these three methods to the hub class to synchronize node creation, move, resize and edit-text operations –

public void NodeCreated(NodeModel clientModel)
{
    Clients.AllExcept(Context.ConnectionId).nodeCreated(clientModel);
}
public void NodeModified(NodeModel clientModel)
{
    Clients.AllExcept(Context.ConnectionId).nodeModified(clientModel);
}
public void NodeTextEdited(NodeModel clientModel)
{
    Clients.AllExcept(Context.ConnectionId).nodeTextEdited(clientModel);
}

The diagram event handlers in MindMap.js fill in the model objects and call respective hub methods –

function onNodeCreated(s, e)
{
    var hubId = $.connection.hub.id;
    e.node.id = hubId + s.getItems().length;

    var r = e.node.bounds;
    var model =
    {
        id: e.node.id,
        x: r.x,
        y: r.y,
        width: r.width,
        height: r.height
    };
    
    diagramHub.server.nodeCreated(model);
}

function onNodeModified(s, e)
{
    var r = e.node.bounds;
    var model =
    {
        id: e.node.id,
        x: r.x,
        y: r.y,
        width: r.width,
        height: r.height
    };
    diagramHub.server.nodeModified(model);
}

function onNodeTextEdited(s, e)
{
    var model =
    {
        id: e.node.id,
        text: e.getNewText()
    };
    diagramHub.server.nodeTextEdited(model);
}

Handle notifications sent from server to clients by updating the diagram from received model objects –

$(function ()
{
    diagramHub = $.connection.diagramHub;
    diagramHub.client.nodeCreated = function (model)
    {
        var node = diagram.factory.createShapeNode(
            model.x, model.y, model.width, model.height);
        node.id = model.id;
    };
    diagramHub.client.nodeModified = function (model)
    {
        var node = findNode(model.id);
        node.setBounds(
            new MindFusion.Drawing.Rect(
                model.x, model.y, model.width, model.height),
            true);
    };
    diagramHub.client.nodeTextEdited = function (model)
    {
        var node = findNode(model.id);
        node.setText(model.text);
    };
    $.connection.hub.start();
});

Finally add these helper functions for finding items and storing a global diagram reference –

function onDiagramLoaded(s, e)
{
    diagram = s;
}

function findNode(id)
{
    for (var i = 0; i < diagram.nodes.length; i++)
    {
        var node = diagram.nodes[i];
        if (id == node.id)
            return node;
    }
    return null;
}

function findLink(id)
{
    for (var i = 0; i < diagram.links.length; i++)
    {
        var link = diagram.links[i];
        if (id == link.id)
            return link;
    }
    return null;
}

Start several copies of the application in separate browser instances on your system (or even on different machines if you publish it on IIS or Azure). Now start drawing nodes, moving them or editing their text – changes done on the diagram in one browser will be immediately reflected in all other browsers connected to the hub. However we aren’t yet synchronizing link operations; lets fix that –

public class LinkModel
{
    [JsonProperty("id")]
    public string Id { get; set; }

    [JsonProperty("originId")]
    public string OriginId { get; set; }

    [JsonProperty("destinationId")]
    public string DestinationId { get; set; }

    [JsonProperty("text")]
    public string Text { get; set; }
}

Add following hub methods in server class –

public void LinkCreated(LinkModel clientModel)
{
    Clients.AllExcept(Context.ConnectionId).linkCreated(clientModel);
}
public void LinkModified(LinkModel clientModel)
{
    Clients.AllExcept(Context.ConnectionId).linkModified(clientModel);
}
public void LinkTextEdited(LinkModel clientModel)
{
    Clients.AllExcept(Context.ConnectionId).linkTextEdited(clientModel);
}

Call them from respective JavaScript handlers of diagram link events –

function onLinkCreated(s, e)
{
    var hubId = $.connection.hub.id;
    e.link.id = hubId + s.getItems().length;

    var model =
    {
        id: e.link.id,
        originId: e.link.getOrigin().id,
        destinationId: e.link.getDestination().id,
    };
    
    diagramHub.server.linkCreated(model);
}

function onLinkModified(s, e)
{
    var hubId = $.connection.hub.id;
    var model =
    {
        id: e.link.id,
        originId: e.link.getOrigin().id,
        destinationId: e.link.getDestination().id,
    };
    diagramHub.server.linkModified(model);
}

function onLinkTextEdited(s, e)
{
    var model =
    {
        id: e.link.id,
        text: e.getNewText()
    };
    diagramHub.server.linkTextEdited(model);
}

Handle link-related client notifications by creating or modifying links –

diagramHub.client.linkCreated = function (model)
{
    var link = diagram.factory.createDiagramLink(
        findNode(model.originId), findNode(model.destinationId));
    link.id = model.id;
};
diagramHub.client.linkModified = function (model)
{
    var link = findLink(model.id);
    link.setOrigin(findNode(model.originId));
    link.setDestination(findNode(model.destinationId));
};
diagramHub.client.linkTextEdited = function (model)
{
    var link = findLink(model.id);
    link.setText(model.text);
};

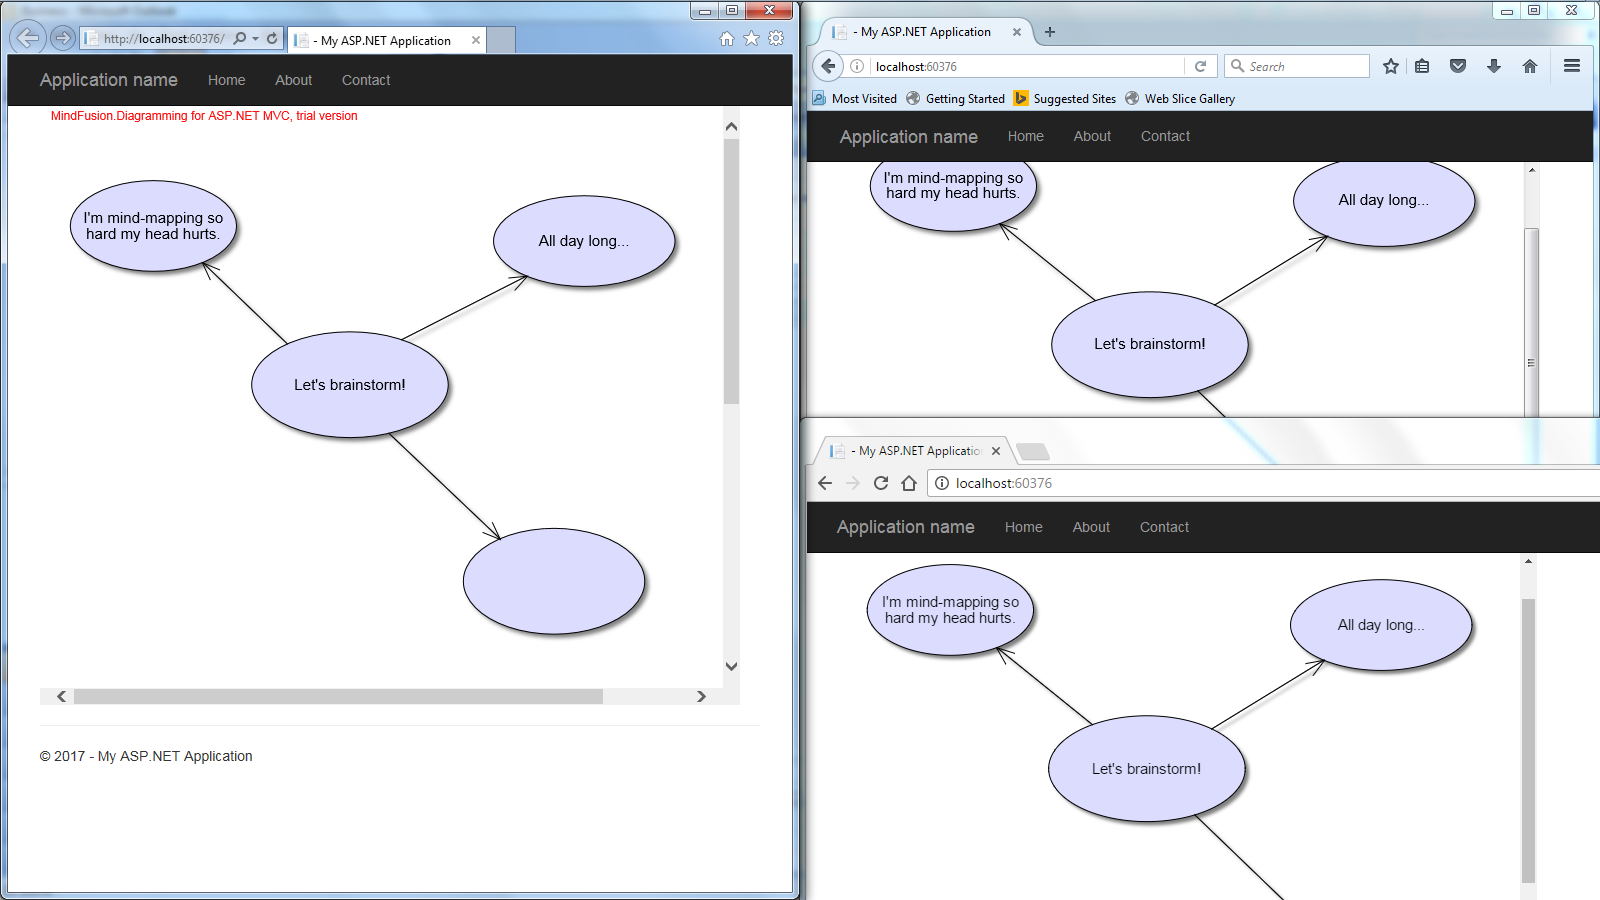
Now the application will also synchronize link operations across all connected clients. Here’s a small diagram synchronized between three different browsers –
collaborative mind map

The sample above uses MindFusion’s ASP.NET MVC API. Code for other frameworks will look similar as MindFusion maintains same diagramming model for multiple platforms. You can download the trial version of any MindFusion.Diagramming component from this page.

Enjoy!