Diagramming for WinForms V.6.0.3

MindFusion has just released a new version of its popular Diagramming component for WinForms. The new features are mostly requested by the users. Here is a list:

ContainerNode Improvements

  • Each container now draws its child nodes. When containers overlap, the children of the lower container can’t appear above the children of the upper container any more.
  • The ClipChildren property indicates whether to clip child items to container’s boundaries
  • The ZIndex property no longer changes automatically when dropping nodes into a container
  • and more
Container nodes

Container nodes

PdfExporter Improvements

  • Clip regions are handled better in custom drawing code
  • PDF shadings now include all colors from a ColorBlend
  • More precise character width when text includes both eastern glyphs and Latin characters.
  • and more.

New events

  • The SetSelfLoopShape event is raised when a link becomes a self-loop, giving you a chance to set a custom shape for the link.
  • The QueryAlignTarget event is raised to determine if a node should be used as alignment guide target when AutoAlignNodes is enabled.
Differently formatted text.

Differently formatted text.

As well other new properties, methods and features – you can read the full list here.

A trial version of the component is available from this link:

Diagramming for WinForms 6.0.3

If you have questions or run into problems using the component you can use the Diagramming for WinForms forum, the help desk or write us at support@mindfusion.eu. Our support team will be pleased to help you.

About MindFusion.Diagramming for WinForms: A programming component that provides any WinForms application with a full set of features for creating and customizing all types of diagrams, flowcharts, schemes, hierarchies, trees, graphs etc. The control provides numerous ways to save and load a diagram, six auxiliary controls and more than 10 automatic graph layout algorithms. Diagram elements include scrollable tables, container nodes, multi-segment arrows, custom diagram item types and many more. Further details here.

Diagramming for WinForms is a royalty-free component, clients get 12 month upgrade subscription when buying a license. The source code is also available for purchase. Visit the buy page for a list with the current license prices.

Diagramming for ASP.NET MVC 1.5

A new version of MindFusion diagramming tool for ASP.NET MVC is released. Here is a list of the new features:

Node Effects

You can now apply two visual effects – the GlassEffect and AeroEffect to nodes. To apply an effect,
you must create an instance of the GlassEffect or AeroEffect classes, adjust its properties and add the instance to the Effects collection of the node. You should use Diagram.NodeEffects if you want to apply the effects on all nodes. Effects can be applied at any time and this will immediately affect the
appearance of the diagram. You can apply more than one effect of the same type as well effects of
different types simultaneously.

Sample themes for your diagrams.

Sample themes for your diagrams.

Radial Gradients

You can set gradient brushes for nodes with the setBrush method. If your gradient blends only two
colors, you can use the color1 and color2 fields to specify them. For more colors you have colorStops.

Multiple Labels per Link

Use the LinkLabel class to set multiple captions on a single DiagramLink object. Link labels provide a set of properties that allow full customization of their appearance and position. Labels support automatic arrangement to avoid overlapping nodes and other labels – set LinkLabel.AutoArrange to true.

A network chart.

A network chart.

New Events

As well other new methods and features. Read the full list at the news page on the MvcDiagram forum
section.
The trial version of the new release is available for download from the following link:

Download MindFusion.Diagramming for ASP.NET MVC 1.4

Technical Support

If you have any questions about Diagramming for ASP.NET MVC you can post them at the forum, the
help desk, or per e-mail at support@mindfusion.eu. Excellent customer support is one of MindFusion top
priorities and we try to provide competent and detailed answers to your questions within hours of
receiving them.

About Diagramming for ASP.NET MVC Component: It is a multi-purpose diagramming tool that consists of
two parts: a .NET class library running on the server and a client side control implemented in JavaScript.

The server side .NET library implements a flow-diagramming object model that lets you define structures
such as trees, flowcharts and graphs. Every element in the diagram is easily accessible and the whole
diagram is rendered as part of an HTML page by just calling the DiagramView extension method.

On the client the diagram is rendered by a DiagramView JavaScript control that draws its content on an
HTML Canvas. The user is able to add nodes and links simply by drawing them with the mouse. There is
also a NodeListView control, which lets users create new nodes via drag and drop.

MvcDiagram also supports various automatic layout algorithms that will make every diagram easy to
understand and beautiful to look at. The diagram can also be easily serialized in binary or XML format.
Exporting is done in a variety of formats including Pdf, Svg, Visio and more. You can read details about
the components at the MvcDiagram features page.

Diagramming for WinRT Beta Version

We have almost finished the initial release of MindFusion.Diagramming component for WinRT. The release
implements most of the API of the MindFusion.Diagramming for Silvelright component. You can read the online reference here:

Diagramming for Silvelright Online Reference

MindFusion.Diagramming for WinRT

MindFusion.Diagramming for WinRT

The Magnifier and Overview controls as well the printing functionality are currently not supported.
Single-touch events are equivalent to mouse input in the Silverlight control. Additionally, the WinRT library implements the following multi-touch gestures:

  • dragging two fingers in same direction over a node translates it
  • dragging two fingers in opposite directions over a node scales and/or rotates it
  • dragging two fingers over an unoccupied point pans the diagram

If the diagram is inside a ScrollViewer, multi-touch gestures are handled only if the ManipulationMode property is set to None; otherwise they are intercepted by the parent ScrollViewer control.

When adding references to the MindFusion.* assemblies, their accompanying resource folders (MindFusion.Diagramming and MindFusion.Diagramming.Controls) must be in the same location as the dll files. If copying or moving the diagramming.dll assemblies, you must also copy these folders in order for Visual Studio to discover the necessary resources.

You are welcome to download and test the beta version:

MindFusion.Diagramming for WinRT Beta Version

Your feedback is highly appreciated. You can write your reviews at the forum or at support@mindfusion.eu.
Thank you.

MindFusion.Pack for WPF 2013.R1

We have just has released MindFusion.Pack for WPF 2013.R1. There are new features in most of the components in the pack. Here are the details:

Support for VisualStudio 2012

The pack installer creates VS2012 toolbox palette for all the components and can optionally install VS2012 sample projects. Toolbox palettes are also created for all .NET target environments supported by the respective Visual Studio versions.

chartMindFusion.Charting

Style and Themes

Styles define the appearance of a given chart element – the axis, the series, the legend. Each ChartTheme is a collection of styles. You can:

• create themes based on the appearance of an existing chart
• create themes with the ThemeEditor tool
• save themes to XML files
• load themes from XML files
• use a number of predefined themes
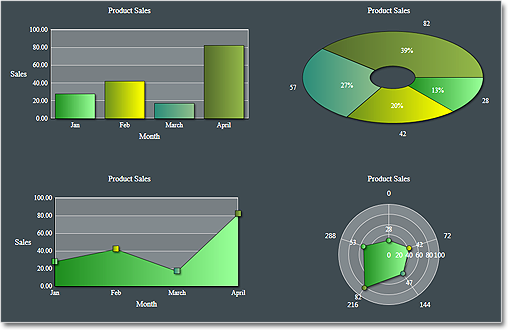
The green theme

The green theme

Improved Design Time Support

You can now edit all collection properties, including the Series collection, the brushes, strokes, legends and all other collections in design time through the property grid.

Axis Intervals

The new AxisSettings.IntervalCount property lets you specify the exact number of intervals at the axis. In such case the control does not use the Interval property and calculates the value of each interval based on AxisSettings.Min, AxisSettings.Max and AxisSettings.IntervalCount.
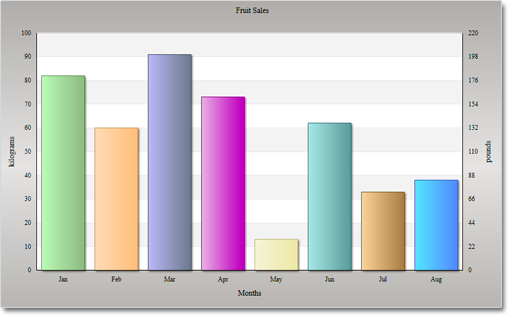
A bar chart with two Y-axes.

A bar chart with two Y-axes.

API Changes

diagram16x16MindFusion.Diagramming

Preserve order in tree layout

You can set now the Balance property of the TreeLayout to Preserve if you want to keep the original geometric order of child nodes when arranging them under their parent. This can be used to arrange tree branches in a specific order by first positioning them in increasing horizontal or vertical positions.
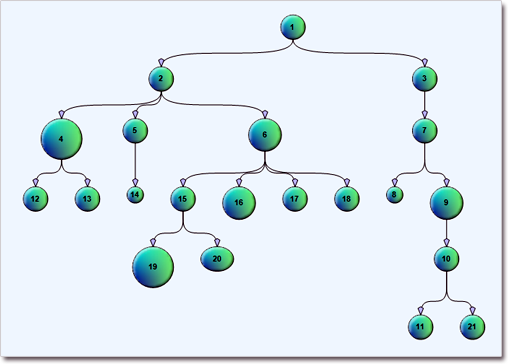
The tree layout.

The tree layout.

Selection improvements

  • Set Behavior to SelectOnly to let users select existing items, but not modify them or draw new ones.
  • Use the SetsDirtyFlag property of the Selection class to specify whether the Dirty flag should be set when selection changes.
  • The SelectionStartMoving event is now raised when the user begins moving multiple selected items.
  • Use the ToggleSelection modifier key to select or deselect items by clicking. The key disables selection via lasso rectangle.

Miscellaneous

Container nodes

Container nodes

Report-16x16MindFusion.Reporting

Exporting

You can now use the new PdfExporter and MhtmlExporter, which enable exporting to the PDF and MHTML formats respectively. You can find detailed information about the new exporters in the “Exporting Reports” theme.

Side-By-Side Containers

You can arrange items parallelly by putting them inside the new SideBySideContainer report item. You can use it, for example, to display two (or more) data ranges one next to the other.

A classic report.

A classic report.

Miscellaneous

• New DefaultEncoding property in PdfExporter;
• New Median aggregate function;

Calendar-16x16MindFusion.Scheduling

Improved item presenter

The ItemPresenter class gives you the start and end time of the represented item fragment through the new
StartTime and EndTime properties. In addition, derived classes can override the new OnStartTimeChanged,
OnEndTimeChanged, and OnItemPropertyChanged methods to get notified when the StartTime or EndTime properties change or when any property of the underlying item changes.
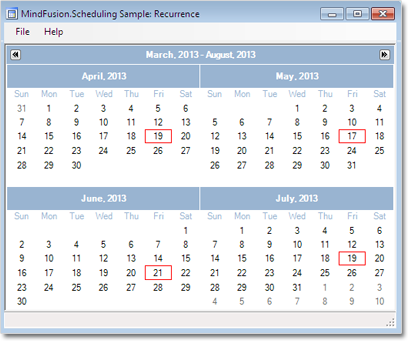
Item recurrence

Item recurrence

Improved recurrence

You can validate and customize the occurrences of a recurrence pattern with the new ValidateOccurrence event of the Recurrence class.

You can find more about the new features of the components at the forum. Here is a link to download the trial version:

Download MindFusion.Pack for WPF 2013.R1

About MindFusion.Wpf Pack: A set of advanced WPF components that help you build your business application easy and on time. The tools provide you with a complete set of features to create, edit and render complex flowcharts, charts, diagrams, calendars, schedules, maps and reports. A set of gauges and UI elements is also included. Each component offers various samples, tutorials and detailed documentation. The controls offer simple and intuitive API, completely customizable appearance, numerous input/output options and a rich event set. Each tool has been thoroughly tested to guarantee that you and your application get the high quality and performance you deserve.

You can read more about the capabilities of each component at its features page:

Prices and licenses are explained in details at the buy page. We offer permanent discounts to certain types of commercial as well non commercial organizations – check here if you qualify.

Diagramming for JavaScript 1.6

MindFusion has released a new version of its diagramming library for JavaScript. Here is an overview of
the most important new features in the control:

Node Effects

You can now apply two visual effects to your nodes – the GlassEffect and AeroEffect. In order to apply
an effect, create an instance of the respective class, set its properties and add the instance to the
Effects collection. You can add, remove or modify effects at any time and this will immediately affect the appearance of the diagram. You can apply effects of different types simultaneously.

Visual effects applied on diagram nodes.

Visual effects applied on diagram nodes.

Multiple labels per link

The new LinkLabel class lets you display multiple captions for a single DiagramLink object. You can fully
customize the display and positioning of the link labels. The new LinkLabel.AutoArrange property lets you arrange automatically the labels to avoid overlapping.

Selection of multiple items.

Selection of multiple items.

New events

Miscellaneous

  • The new setVirtualScroll method enables the virtual scrolling mode. In this mode, the canvas stays as big as its containing div, and its content is drawn with a translation bound to the div’s scrollbar positions. This allows displaying large diagrams in browsers and on mobile devices where the size of the HTML canvas elements is limited.
  • resizeToFitText method is added to ShapeNode.
  • Improved support for nested containers.

You can find out more about the new release at the Diagramming News section on our forum. You are welcomed to download the trial version and check yourself the capabilities of the control. Use the link below:

Download MindFusion.Diagramming for JavaScript Library 1.6

We have always taken special effort in providing quality technical support to all our clients and evaluators. You can write us at e-mail support@mindfusion.eu or use the help desk. You can use the JsDiagram section on MindFusion forum to post questions about the tool.

About Diagramming for JavaScript Library: Written 100% in JavaScript, this tool uses HTML5 Canvas to draw impressive diagrams, schemes, flowcharts, trees and many more. It is browser independent, easy to use and integrate into any web application. JsDiagram supports a variety of predefined node shapes, customizable links, rich event set and many appearance options. The user interaction model includes resizing / moving / selecting and modifying any diagram element.

The tool boasts an elegant API, which is documented in details as well numerous step-by-step guides and tutorials. Various samples are provided to let you learn quickly how to use the most important features of the library – check them here. JsDiagram is not only the perfect choice for creating any type of diagram in the browser – it can also arrange it the way you wish with a mouse click using one of its automatic graph layout algorithms. For more details about the features of the component, please visit the features page.