We are pleased to announce new versions for two of MindFusion’s WPF components – Reporting and Scheduling. Below we list the new features and improvements in each of the controls.
![]() New in Scheduling for WPF, V3.4
New in Scheduling for WPF, V3.4
Interactive Recurrence Rescheduling
Recurrences can be rescheduled interactively by holding down the RescheduleRecurrenceKey while dragging a recurrent item. The control tries to preserve the current pattern of the recurrence when possible. Otherwise, you can modify the recurrence to accommodate to the new start and end times of the modified item. Interactive rescheduling is not registered in the undo history.
New Theme
A new built-in theme is available in the Scheduler control – the Light theme. It is available through the ThemeType enumeration.
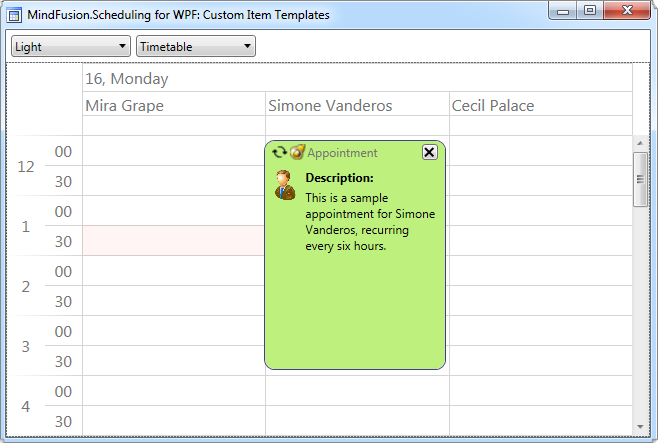
Scheduler for WPF: The Light Theme
New API Members
Several new properties and events have been added to the control:
- The RescheduleRecurrenceKey property in the Calendar class can be used to modify recurrences interactively.
- TickSize added to the ResourceViewSettings class.
- Calendar.FilterItem event.
You can download the trial version of the control directly from this link:
Scheduling for WPF, V3.4 Trial Version Download
The component is also available on Nuget. To install the component, run the following command in the Package Manager Console:
PM> Install-Package MindFusion.Scheduling.Wpf
![]() New in Reporting for WPF, V1.4
New in Reporting for WPF, V1.4
Report Parameters
Parameters can now be added to a report through the new Parameters collection of the Report class. The parameters provide name, description and value and can be of any type, including expression. For more information about parameters, check the Report Parameters topic.
Barcodes
MindFusion WPF Reporter can now display UPC-A, UPC-E, EAN-8, EAN-13, and QR barcodes. The barcodes are represented by the new Barcode report item.
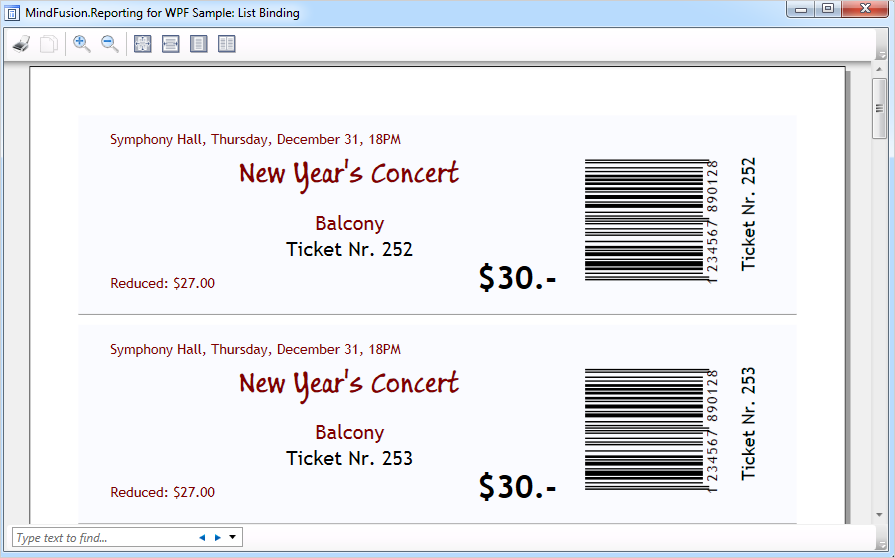
WPF Reporter: Barcode Report Items
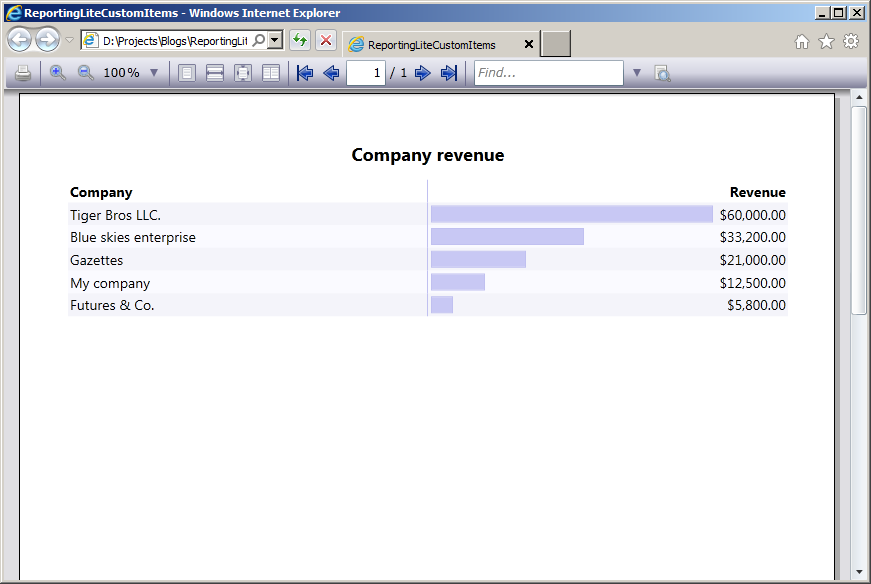
Improved charts
Several new properties have been added to the LineChart class to imporive the customization for the plot, grid, legend and axes. The axes settings can be specified through the new XAxisSettings and YAxisSettings properties. The AxesChart class exposes four new properties, which can be used to specify the intervals displayed by the chart axes. The new properties are XMinValue, XMaxValue, YMinValue, and YMaxValue.
Miscellaneous
- Report items can be searched by name through the new FindItem method.
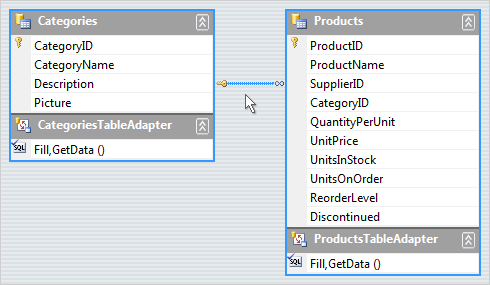
- Fixed an issue with horizontal data ranges.
- Items in data range headers and footers can now bind to the data source of the data range.
- New sample illustrating the Barcode report items.
You can download the trial version of the control directly from this link:
Reportingfor WPF, V1.4 Trial Version Download
The component is also available on Nuget. To install the component, run the following command in the Package Manager Console:
PM> Install-Package MindFusion.Reporting.Wpf
Technical support: You can write at the Scheduling for WPF discussion board and Reporting for WPF discussion board. Additionally, you can write us at support@mindfusion.eu. Anyway we’ll be glad to answer your questions, comments and recommendations and assist you on how to use the MindFusion WPF controls.
About Scheduling for WPF: The perfect programming tool to enhance your WPF application with a compelling set of ready-to-use calendar features. Choose among six types of schedule views all optimized for high performance and easy customization. Treat your users to the convenience of creating appointments with reminders and recurrence options on the fly with the built-in forms. Change every single calendar element to achieve the perfect look without compromise – apply styling, customize the fonts and colors or simply set one of the elegant predefined themes. Persisting the calendar into a variety of formats is easily done with the integrated exporters and importers. The control is also packed with a rich event set that gives you full control over the user’s actions. More about Scheduler for WPF here.
About Reporting for WPF: A programming tool that provides developers with everything they’ll need to create high-impact data driven reports using WPF. The control supports comprehensive list of report elements, which can be nested, combined and customized to create reports optimized for the needs of your current WPF application. A full-featured chart component is integrated into the report tool and you can extend every single report with a compelling chart of your choice. The report can be saved into a variety of formats and rendered on the screen with the built-in elegant viewer for optimal performance. Further details about MindFusion WPF Reporter here.