In this blog post we will look at the different levels of styling the elements and items of a schedule made with a MindFusion scheduling library. In our sample we use the Java Scheduling Library, but the API members that we use and the cascading levels of styling a schedule are universal across all MindFusion Scheduling components.
I. Top Level: Theme
At the top level of styling you have themes. The scheduling library has a set of predefined themes: Light, Lila, Silver, Standard, Vista, Windows2013. You apply one of the predefined themes this way:
calendar.setTheme(ThemeType.Vista);
Here is what the calendar looks like styled with the vista theme:
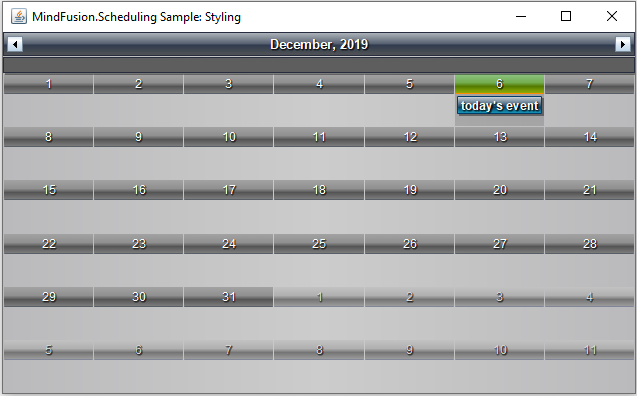
In JavaScript, the themes are defined in CSS styles and you must reference the desired file and set the name of the theme to the calendar instance. In the other libraries, they are built-in and usually are available as members of an enum.
You have the option to create a custom theme, which you can save and apply this way:
calendar.setCustomTheme(new MyTheme());
Another way to apply the custom theme in Java Scheduling is:
calendar.setCustomTheme(new MyTheme());
Here is the look of the calendar with the custom theme:
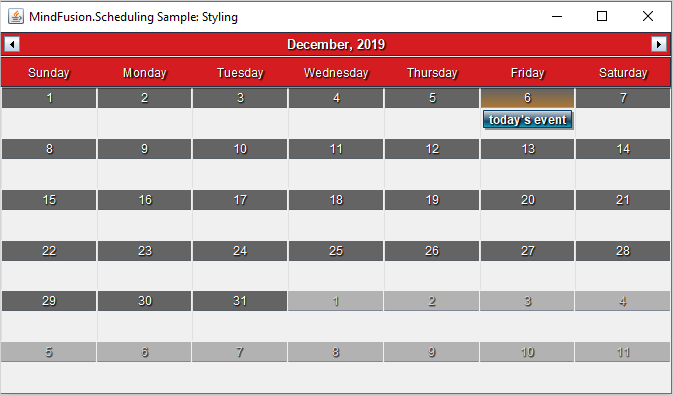
The custom theme has changed some of the colors, widened the header so that the week days could be seen and set some borders on the cells.
Creating a custom Theme requires that you override a strict set of methods. They are the public members of the Theme class. You should override all of them. Among the methods that style the calendar for each view – getMonthRangeSettings getMonthSettings etc. You could override in detail only the method that is responsible for styling the view you would use – if it is only one. For the rest of the methods you could just write:
private void initialize_MyTheme_ListViewSettings()
{
	_listViewSettings = super.createListViewSettings();
}
Every method in the Theme class must be dutifully implemented and all settings set. That comes from the fact that a Theme is the last and topmost styling instrument and it must know how to style any element that might not be explicitly styled down the tree.
The online and offline documentations of the Java Scheduling library come with topics that list in details the styling settings for each of the predefined themes. Our advice is that you get the code of the Theme that looks closest to what you want to have as a structure and modify it.
The sample project that you can download at the bottom of this post implements a custom Theme based on the Vista theme and lists all members in a theme that you must set with all details.
II. View and Item Settings
One level down the tree are the view settings properties. They are available for any view. You can access those settings with the getMonthSettings getMonthRangeSettings etc. methods. Each one of those methods returns the styling settings of a particular view. You should use the one that corresponds to the view you’ve chosen:
//set the view to SingleMonth
calendar.setCurrentView(CalendarView.SingleMonth);
//get the styling settings for SingleMonth view
calendar.getMonthSettings().getDaySettings().setTodayFillColor(Color.green);
You can style the items, regardless of the view used, with the ItemSettings object:
calendar.getItemSettings().setPadding(20);
The *Settings properties define the appearance of items in terms of alignment, spacing, padding, shadow, date format. The coloring of the elements is left to Style instances. Thus, if you want to change the color of items, you will use:
//customize just the items through the itemSettings field
calendar.getItemSettings().setPadding(20);

Style itemStyle = new Style();
itemStyle.setBrush(new SolidBrush(Color.white));
itemStyle.setHeaderTextColor(Color.DARK_GRAY);
itemStyle.setHeaderTextShadowStyle(ShadowStyle.None);
calendar.getItemSettings().setStyle(itemStyle);
This styles all items on the calendar. For styling a particular item, you should use on of the methods listed underneath.
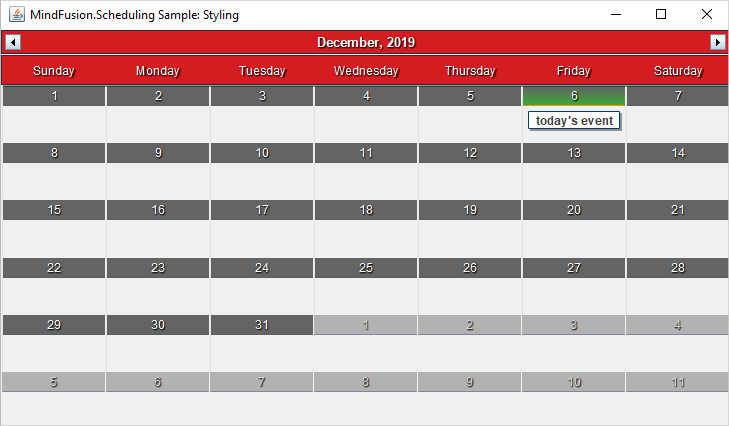
Our calendar now has green header on the current day, the background of events is white and there is a bit of a padding added to the events.
III. Using Events to Style Particular Items
When you want to select items that you want to style based on some distinct characteristics, you can use events. In our sample we handle the itemCreated event, where we check if the start date of an appointment happens to be during the weekend:
// Listen for item creation and for draw events
calendar.addCalendarListener(new CalendarAdapter(){
	//apply custom styling to selected items
	public void itemCreated(ItemEvent e) {
		onItemCreated(e);
	}
});
The Java Scheduler provides various events, which are accessible through a CalendarListener and CalendarAdapter instances. We handle the itemCreated event this way:
//color in red events that are scheduled to start on weekends
protected void onItemCreated(ItemEvent e) {

	Item item = e.getItem();
	if(item.getStartTime().getDayOfWeek() == DayOfWeek.Saturday ||
		item.getStartTime().getDayOfWeek() == DayOfWeek.Sunday)
		{
			item.getStyle().setBrush(new SolidBrush(new Color(213, 28, 32)));
			item.getStyle().setHeaderTextColor(Colors.White);
			item.getPointedStyle().setBrush(new SolidBrush(new Color(100, 100, 100)));
		}
}
The ItemEvent class provides the item that was created and you can use the instance to apply any particular styling to the item.
Here is our scheduler, which now colors the items on weekends in red:

In JavaScript, the items have a special field that allows you to assign to them a custom CSS style that you’ve defined. The style will be applied to the particular item only. The field is called ‘cssClass’.
IV. Custom Drawing
When you need to style in a very unique way calendar elements and nothing else helps, you have the option to draw them the way you want. Custom drawing can be made for many parts of the calendar. The available elements are identified as members of the CustomDrawElements enumeration.
You tell the control that you want to use custom drawing this way:
//specify that we will use custom drawing
calendar.setCustomDraw(EnumSet.of(CustomDrawElements.CellContents));
The custom drawing must be part of the draw method, which is also a member of CalendarListener:
// Listen for item creation and for draw events
calendar.addCalendarListener(new CalendarAdapter(){


//add custom drawing to CellContents
@Override()
public void draw(CalendarDrawEvent e) {
	onDraw(e);
	}

});
The event handler method looks like this:
//apply custom drawing to selected items
private void onDraw(CalendarDrawEvent e)
{
	if (e.getElement() == CustomDrawElements.CellContents)
	{
		DateTime date = e.getDate();

		//color in light yellow the background of the first 10 days of a month
		if (date.getDay() < 11)
		{
			// Do the custom drawing
			Rectangle2D bounds = new Rectangle2D.Double(
			e.getBounds().getX(), e.getBounds().getY(),
			e.getBounds().getWidth() - 1, e.getBounds().getHeight() - 1);
			new AwtGraphics(e.getGraphics()).fillRectangle(Brushes.LightYellow, bounds);
		}
	}
}
The Calendar’s drawEvent class gives us useful methods to learn more about the item that is being drawn. In our case we want to draw the cell contents, so we check if draw was called for the cell contents, and if yes, we get the bounds of the element. We need the check, because draw is called for all elements that support custom drawing and we need to identify which one is drawn at the moment.
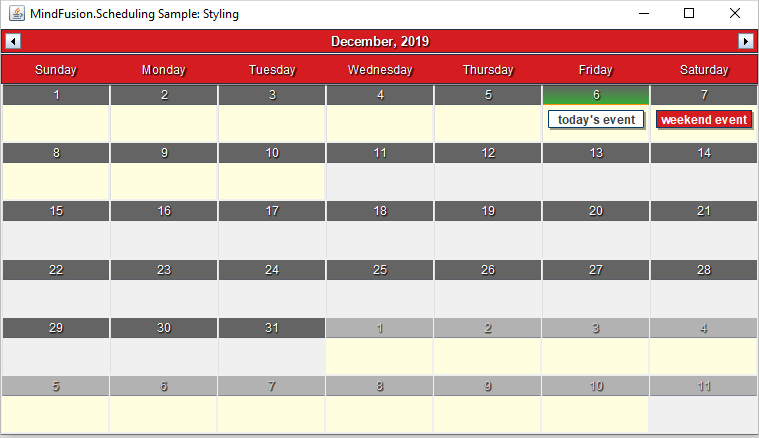
Thanks to the custom drawing, the monthly schedule now has a light yellow background on the first ten days of the month:
With this our review of the methods to style a schedule is finished. You can download the complete source code of the sample together with all MindFusion libraries used from this link:
How to Style a Java Schedule: Download Project Source Code
You can post questions about Mindusion Scheduling components at MindFusion online forums.
About MindFusion Scheduling Components MindFusion Scheduling components are available for a variety of platforms for web, mobile and desktop programming. All of them include a robust feature set that includes 6 calendar views, predefined themes, various events, predefined forms for creating appointments and recurrence. The components are fully interactive, easy to customize and style and are the ideal choice for any application that needs to implement time management features. You can learn more about MindFusion Scheduling tools at https://mindfusion.eu/scheduling-pack.html.
