MindFusion is pleased to announce the new releases of two of its popular flowchart control: Diagramming for WinForms, V6.3.3 and Diagramming for WPF, V3.3.1. Both releases have similar new features, which are listed below:
Resize table columns and rows
Columns and rows of a TableNode can now be resized interactively if its AllowResizeColumns or AllowResizeRows properties are enabled. In order to resize, move the mouse pointer to the border line on column’s right side or row’s bottom side until it shows resize cursor and start dragging. The control raises TableColumnResizing and TableRowResizing events to let you validate new size or prevent resizing some elements. The TableColumnResized and TableRowResized events are raised after the operation completes.
Barcode nodes
The BarcodeNode class displays EAN, UPC or QR barcodes as node’s content. In-place edit operations let users enter new numeric codes for 1D codes or text strings for QR codes. The barcode format is specified via the Format property, the encoded number or text is set via Content, and color of 1D bars / 2D modules via BarColor.
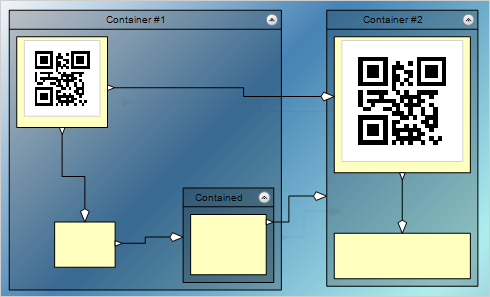
Barcode diagram nodes
New Features in Diagramming for WPF, V3.3.1
ShapeDesigner improvements
- The ShapeDesigner control supports undo. Call its Undo or Redo methods to respectively undo or redo a change done to the designed shape.
- ZoomFactor property added to ShapeDesigner. It also supports interactive zoom in/out via mouse wheel.
- The SelectedElement property exposes the graphic element currently selected in ShapeDesigner canvas. You can bind to its stroke and brush properties to create alternative user interface for editing element attributes.
Miscellaneous
- NodeConstraints.KeepInsideDiagram prevents a node from leaving diagram boundaries during user interaction (the older RestrictItemsToBounds property does not stop nodes from leaving diagram area but returns them to original position if dropped outside).
- dashed selection frames are now drawn in two colors and should be visible on both the default white background and custom darker backgrounds. You can change the second dash color via HandlesVisualStyle.DashBackground property.
- set the WhileModifying flag in RoutingOptions.TriggerRerouting to reroute links while users drag their end points.
- custom connection point classes can now override ConnectionPoint.NearestAnchorPoint to implement custom anchor point selection logic; the method is now also called at the beginning of interactive link creation.
New in Diagramming for WinForms, V6.3.3
Miscellaneous
- the component now selects better end points for auto-routed links when using WhileCreating and WhileModifying routing modes;
- custom connection point classes can now override ConnectionPoint.NearestAnchorPoint to implement custom anchor point selection logic; the method is now also called at the beginning of interactive link creation.
- NodeConstraints.KeepInsideDiagram prevents a node from leaving diagram boundaries during user interaction (the older RestrictItemsToBounds property does not stop nodes from leaving diagram area but returns them to original position if dropped outside).
- SvgNode supports SVG images with vector-effect=’non-scaling-stroke’ stroke attributes.
- improved default Pen for dash-frame selection handles style. Dashed frames should now be visible on both the default white background and custom darker backgrounds.
- ZoomControl can now be used with other components by MindFusion and has been moved to MindFusion.Common.WinForms assembly and namespace.
You are welcome to download the trial version for each control from the following links:
Diagramming for WinForms, V6.3.3 Trial Version Download
Diagramming for WPF, V3.3.1 Trial Version Download
If you have questions or run into problems using the components you can use the Diagramming components forum, the help desk or write us at support@mindfusion.eu. Our support team will be pleased to help you.
About MindFusion.Diagramming for WinForms: A programming component that provides any WinForms application with a full set of features for creating and customizing all types of diagrams, flowcharts, schemes, hierarchies, trees, graphs etc. The control provides numerous ways to save and load a diagram, six auxiliary controls and more than 10 automatic graph layout algorithms. Diagram elements include scrollable tables, container nodes, multi-segment arrows, custom diagram item types and many more. Further details here.
Diagramming for WinForms is a royalty-free component, clients get 12 month upgrade subscription when buying a license. The source code is also available for purchase. Visit the buy page for a list with the current license prices.
About MindFusion.Diagramming for Wpf: Designed and developed to be easy to integrate, use, and customize, this native WPF flowchart component places at your disposal every single feature you would ever need to create diagrams, graphs, schemes, org charts, DB relationships, genealogy trees, class hierarchies and many more. Its long list of style options gives you complete control over the appearance of the diagram. With a set of eight automatic layouts you are sure to find the arrangement that suits perfectly your WPF application.
The diagram control boasts a long list of events, properties and methods for user interaction, item creation, data input and output. You can read the full features list here. The online demo shows samples that demonstrate various capabilities of the control. The licensing scheme and prices are uploaded at the buy page. Source code is also available.