MindFusion Pack for ASP.NET 2014.R1

We have just released MindFusion.WebForms Pack 2014.R1. The diagramming component in the pack offers several new features – here is an overview:

diagram16x16Diagramming for ASP.NET

Import of Visio 2013 files
The new Visio2013Importer class can import *.vsdx files, created by Visio 2013. It is part of the MindFusion.Diagramming.Import.Visio.dll assembly and you must reference it if you want to use the importer. The Import method has various overloads, which let you choose how the Visio diagram is imported – as a whole diagram whose content is merged from all imported pages or as a DiagramDocument, whose pages correspond to the Visio drawing pages. Each Visio connector and node shape in the original diagram is represented by a matching DiagramLink and DiagramNode object in the resulting flowchart.

Canvas mode improvements

  • The HandlesStyle property of nodes is now supported in Canvas mode.
  • Dynamic links are now supported in Canvas mode.
  • You can apply layout algorithms to the content of a ContainerNode by calling its arrange method.
  • and more.

Java mode improvements

  • RoundedLinks and RoundedLinksRadius properties are now supported in Java mode.
  • AutoSnapLinks is now honored in Java mode; links drawn interactively snap to a nearby node from a distance.
  • createFontEx method added to ScriptHelper creates bold, italic and underlined fonts.
  • as well other improvements.

Miscellaneous

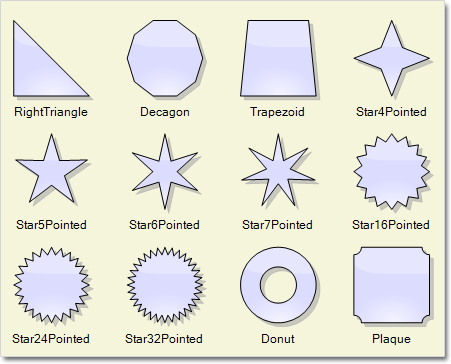
Several new predefined shapes are available in the Shapes class – RightTriangle, Decagon, Trapezoid, Star4Pointed, Star5Pointed, Star6Pointed, Star7Pointed, Star16Pointed, Star24Pointed, Star32Pointed, Donut and Plaque.

The new predefined node shapes.

The new predefined node shapes.

The trial version is available for download from this link:

Download MindFusion Pack for WebForms, 2014.R1

About MindFusion.WebForms Pack: A set of WebForms components that add great variety of features to your ASP.NET application with a few mouse clicks. The pack contains advanced components for diagramming, scheduling, charting and UI (Accordion, ColorPicker, TabControl, Window, WindowHost, DockControl, Button, Slideshow, Zoom and more). Each tool boasts easy to learn and use API and is quickly integrated into any web application that targets the ASP.NET platform. The controls support numerous options for styling, data import / export, user interaction and offer rich event set. There are plenty of samples and step-by-step tutorials as well detailed documentation.

Use the features page for each of the tools to find out more about its capabilities and
the numerous ways it can boost your performance and speed up the development of your application:

Visit the buy page for details on the licensing scheme and prices. If you have questions please contact us. We shall be happy to assist you.

MindFusion.WinForms Pack 2014.R1

MindFusion has just released a new version of its pack of components for WinForms. Here is an overview of the major new features:

Support for Visual Studio 2013

You can now install a toolbox palette for the components in VS2013 as well choose to install VS2013 sample projects.

Spreadsheet-16x16MindFusion.Spreadsheet

MindFusion.Pack for WinForms boasts a brand new component – MindFusion.Spreadsheet for WinForms. It’s a powerful tool for creating complex spreadsheets of all type. The control supports formulas, cell spanning, various import/export options, images and a long list of style & appearance settings. Read more about MindFusion.Spreadsheet for WinForms here.

A spreadsheet created with the new component.

A spreadsheet created with the new component.

diagram16x16MindFusion.Diagramming

Import of Visio 2013 Fies

The new Visio2013Importer class can import .vsdx files created by Visio 2013. The class is part of the MindFusion.Diagramming.Import.Visio.dll assembly and you must reference it if you want to use the importer in your project. The class provides various overloads of the Import method, which let you choose how the diagram is imported – as a DiagramDocument, whose pages correspond to the Visio drawing pages or as a single Diagram, whose content is merged from all imported pages.

Zoom control

The ZoomControl class lets you interactively change the zoom level and scroll position of a DiagramView. It is very easy to set it – place the Zoom control anywhere over a DiagramView and set the control’s Target property to that view. The control provides various customization properties like ZoomStep, ScrollStep, Fill, BorderColor, CornerRadius and more.

Miscellaneous

  • You can change the active page in a TabbedDiagramView control with the arrow buttons When AllowRenamePages is enabled, DiagramPage titles can be renamed interactively by clicking the active tab in a TabbedDiagramView.
  • Several new shapes added for better compatibility with Visio 2013 basic stencil: RightTriangle, Decagon, Trapezoid, Star4Pointed, Star5Pointed, Star6Pointed, Star7Pointed, Star16Pointed, Star24Pointed, Star32Pointed, Donut, Plaque.
  • and more.
The new predefined node shapes.

The new predefined node shapes.

Calendar-16x16MindFusion.Scheduling

Improved support for non-Gregorian calendars

MindFusion.Scheduling now provides better support for non-Gregorian calendars, such as Hijri. The control can also display a Persian calendar through the new PersianCulture. Use the Culture property of the Calendar class to specify the calendar to be used by the control.

New holiday provider

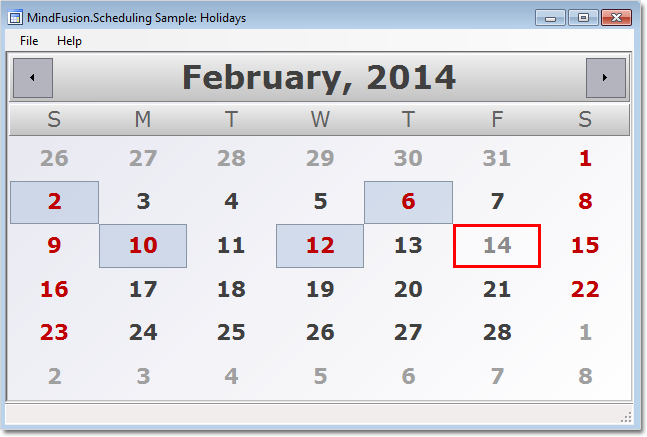
You can use the new AustraliaHolidayProvider (available in the MindFusion.HolidayProviders.dll assembly) to supply the major holidays in Australia for a specific time interval.

A sample calendar with holidays.

A sample calendar with holidays.

The trial version is available for direct download from this link:

Download MindFusion.WinForms Pack 2014.R1

If you run into problems with any of the components, please let us know. We shall be glad to assist you. MindFusion is proud with its excellent technical support – the majority of the questions are answered within hours of receiving them.

About MindFusion.WinForms Pack: A set of five WinForms programming components that provide your application with a rich choice of diagramming, charting, scheduling, mapping, reporting and gauge features. The tools are very easy to implement and use. They boast intuitive API and various step-by-step tutorials to get you started. Both online and offline documentation is available. A sample browser presents you with all the samples for each control to let you easily navigate to what you need. You can check some of the features of each component right now if you look at the online demos:

Visit the features – page of the components for more information about their capabilities:

You can check the prices and licensing scheme here. All components are royalty-free.

MindFusion Pack for ASP.NET, V2013.R2

MindFusion has released Pack for ASP.NET, V2013.R2. Here is an overview of the most important new features in the components within the pack:

diagram16x16 MindFusion.Diagramming for WebForms

Import of OpenOffice Draw files

The new DrawImporter class lets you import *.odg files created by the OpenOffice Draw Vector graphics editor. You just need to add a reference to the MindFusion.Diagramming.Import.Draw.dll assembly and are ready to use it. You can use various overloads of the Import method to import the OpenOffice drawing into a DiagramDocument whose pages correspond to the Draw pages, or into a single Diagram whose content is merged from all imported pages.

Import any type of diagram from

Import any type of diagram from an *.odg file

Canvas Mode Improvements

ContainerNode Improvements

  • Child nodes are now drawn by their containers; when containers overlap, the children of a lower container cannot appear in front of the upper container anymore
  • The ClipChildren property specifies whether to clip child items to container’s boundaries
  • The ZIndex property no longer changes automatically when dropping nodes into a container
  • and others

Miscellaneous

  • The MeasureUnit property now supports Centimeter and WpfPoint values. The latter allows loading diagram files saved by WPF and Silverlight versions of the control with their default units.
  • SwimlaneLayout now honors the Anchoring.Keep property value.
  • New line and quote characters in Tag strings are now escaped when passed to client-side click events in ImageMap mode, avoiding script errors.
  • As well a few bug fixes and API changes

chartMindFusion.Charting for WebForms

Themes

Chart themes are now XML files that you can save and load with the SaveTheme and LoadTheme methods. You can use the theme editor tool provided with the control to edit, save and load themes in a fast and intuitive way. The control provides an initial set of 8 predefined themes.

Major/Minor Axis Ticks

Use the new MajorTickLength and MinorTickLength properties to divide a chart axis in a more precise and accurate manner. The number and pen for the ticks are set with MinorTicksPerInterval, MajorTickPen and MinorTickPen.

Major and minor axis ticks

Major and minor axis ticks

ToolTips

You can apply tooltips on all chart types. Area charts in particular can show a different tooltip for every region between two adjacent data points.

Interactive Editing of Data

Line and bar chart elements can be dragged with the mouse. Bars can be dragged either in horizontal or vertical direction according to their orientation. Line chart points can be dragged in any direction. The dragging behavior is set with the Behavior property.

As well other useful new features.

You can read more about the new features of the components in the ASP.NET Pack at the forum. The new version is available for download from this link:

Download MindFusion Pack for WebForms, VR2.2013

About MindFusion.WinForms Pack: A set of WebForms components that add great variety of features to your ASP.NET application with a few mouse clicks. The pack contains advanced components for diagramming, scheduling, charting and UI (Accordion, ColorPicker, TabControl, Window, WindowHost, DockControl, Button, Slideshow, Zoom and more). Each tool boasts easy to learn and use API and is quickly integrated into any web application that targets the ASP.NET platform. The controls support numerous options for styling, data import / export, user interaction and offer rich event set. There are plenty of samples and step-by-step tutorials as well detailed documentation.

Use the features page for each of the tools to find out more about its capabilities and
the numerous ways it can boost your performance and speed up the development of your application:

Visit the buy page for details on the licensing scheme and prices. If you have questions please contact us. We shall be happy to assist you.

Scatter Line Chart in WinForms with a Custom Legend

In this post we show you how to build a multi-series scatter chart with a legend and a separator. We use MindFusion.Charting tool for WinForms.

The Data

The properties that specify data in the control are XData and YData. We add three series to each one for the three series that we want to show. Before that, we clear the arrays, to make sure no previously added data shows on the chart:

 lineChart1.XData.Clear();
 lineChart1.XData.Add(new List{3,4,5,6,7,8,9});
 lineChart1.XData.Add(new List{1,2,3,4,5,6,7,8});
 lineChart1.XData.Add(new List{1,2,3,4,5,6,7,8,9,10});

 lineChart1.YData.Clear();
 lineChart1.YData.Add(new List{92, 112, 241, 195, 201, 188, 212});
 lineChart1.YData.Add(new List{512, 480, 321, 491, 460, 320, 298, 241});
 lineChart1.YData.Add(new List { 340, 302, 322, 401, 487, 503, 421, 460, 513, 490 });

Chart Series

We want to show line series with scatters – since this is the default LineType, we don’t have to set anything. In order to customize our series, we add new pens to the ChartPens property. The colors of the scatters are customized with ShapePens and ShapeBrushes. We make the chart pens a bit thicker – 3 pixels.

 lineChart1.ShapeBrushes.Add(new MindFusion.Drawing.SolidBrush(Color.FromArgb(175, 251, 175)));
 lineChart1.ShapeBrushes.Add(new MindFusion.Drawing.SolidBrush(Color.FromArgb(176, 224, 230)));
 lineChart1.ShapeBrushes.Add(new MindFusion.Drawing.SolidBrush(Color.FromArgb(216, 191, 216)));

 lineChart1.ChartPens.Add(new MindFusion.Drawing.Pen(Color.FromArgb(144,238,144), 3.0f));
 lineChart1.ChartPens.Add(new MindFusion.Drawing.Pen(Color.FromArgb(70, 130, 180), 3.0f));
 lineChart1.ChartPens.Add(new MindFusion.Drawing.Pen(Color.FromArgb(186, 85, 211), 3.0f));

 lineChart1.ShapePens.Add(new MindFusion.Drawing.Pen(Color.FromArgb(144, 238, 144)));
 lineChart1.ShapePens.Add(new MindFusion.Drawing.Pen(Color.FromArgb(70, 130, 180)));
 lineChart1.ShapePens.Add(new MindFusion.Drawing.Pen(Color.FromArgb(186, 85, 211)));

Separator Line

We would like to show a separator line that indicates the average value from all chart data. We add a SummaryValue to the SummaryValues collection. Then we customize the summary line by specifying its pen, scatter type and scatter size. We also set the pen and the brush for the scatters. Here is how we do it:

  lineChart1.SummaryPens.Add(new MindFusion.Drawing.Pen(Color.FromArgb(255,69,0), 4.0f);
  lineChart1.SummaryShapeBrushes.Add(new MindFusion.Drawing.SolidBrush(Color.FromArgb(255,228,225))); 
  lineChart1.SummaryShapePens.Add(new MindFusion.Drawing.Pen(Color.FromArgb(255,69,0));
  lineChart1.SummaryShapes.Add(MindFusion.Charting.Shape.Rhombus);
  lineChart1.SummaryShapeSizes.Add(15.0);
  lineChart1.SummaryValues.Add(MindFusion.Charting.Summary.Average);   

Axes Labels

We want to show custom text at the X-axis, so we set XAxisSettings.LabelType to AxisLabelType.CustomText. We use the XLabels property to add the labels. We also add a title with the XAxisSettings.TitleLabel property.

For the Y-axis we want to show the auto scale – we set it with YAxisSettings.MaxValue, YAxisSettings.MinValue and YAxisSettings.AxisDelta. We show ticks on both axes with the MajorTickLength property.

 lineChart1.YAxisSettings.AxisDelta = 50;
 lineChart1.YAxisSettings.MajorTickLength = 2F;
 lineChart1.YAxisSettings.MaxValue = 600;
 lineChart1.YAxisSettings.MinValue = 0;

 lineChart1.XAxisSettings.AxisDelta = 1;
 lineChart1.XAxisSettings.LabelType = MindFusion.Charting.AxisLabelType.CustomText;
 lineChart1.XAxisSettings.MajorTickLength = 5F;
 lineChart1.XAxisSettings.MaxValue = 11;
 lineChart1.XAxisSettings.MinValue = 0;
 lineChart1.XAxisSettings.TitleLabel = "Year";

The Legend

The labels for the legend are set with the LegendLabels property. The colors are picked automatically from the ChartPens property for each series. We place the legend at the bottom with LegendPosition and increase its offset with LegendOffset. We want the legend in one row, so we set LegendColumns to the count of the labels – 3.

 lineChart1.LegendColumns = 3;
 lineChart1.LegendLabels = new List{"Europe, Asia, North America"};
 lineChart1.LegendOffset = 30f;
 lineChart1.LegendPosition = MindFusion.Charting.Position.Bottom;

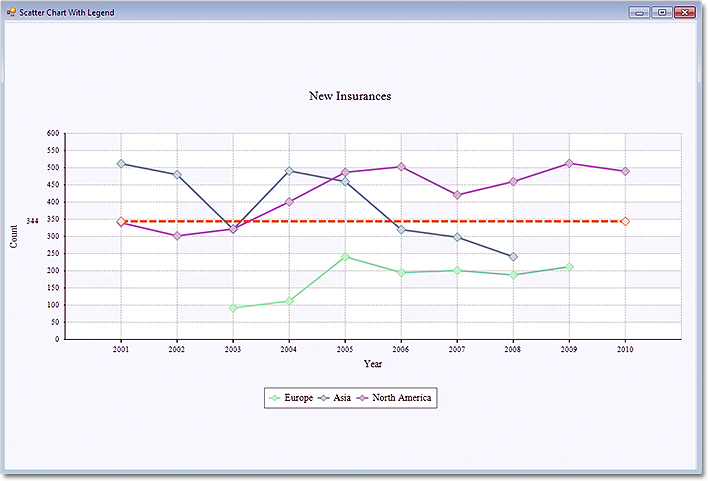
Here is a screenshot from the final chart:

Scatter Chart with a Custom Legend

Scatter Chart with a Custom Legend

You can download the sample from this link:

Download Scatter Chart with a Custom Legend Sample

The trial version of MindFusion.Chart for WinForms boasts many different samples, great charting tips and step by step tutorials. You can download it directly from here:

Download MindFusion.Charting for WinForms 3.5 Trial Version

About MindFusion.Charting for WinForms: a professional programming component for WinForms, which lets you create remarkable charts fast and easy. The tool supports all major chart types – line, pie, radar and bar – and numerous variations of them – column, area, bubble, polar, doughnut etc. 3D charts are supported as well.

Charting for WinForms supports a rich user interaction model with features like zoom, hit testing, drill down, mouse dragging and more. You can use delegates to present mathematical functions, undefined values are also acceptable. Values can be data arrays or retrieved through a database.

The appearance of each chart is fully customizable. The control offers strong design-time support with custom collection editors and chart wizards. At your disposal is a set of predefined appearance themes and a theme editor tool. A full list of the features can be read here.

ASP.NET Bar Chart with Custom Labels

In this blog post we will look on how to build a bar chart with multiple series, custom X-labels and inner labels using MindFusion.Charting for ASP.NET control.

1. General Appearance of the Chart

We want to show three data series and we want to show the first values of each series in a cluster, then second cluster with the second values of each series etc. In order to render the bars in this order we set the BarType property to BarType.Clustered3D. We correct the Depth3D to make the bars less thick and increase the distance between each series with DistBtwBars. We make the bars wider, setting BarWidth to 30.

    //general appearance
    BarChart1.BarType = MindFusion.Charting.BarType.Clustered3D;
    BarChart1.BarWidth = 30f;        
    BarChart1.Depth3D = 15f;
    BarChart1.DistBtwBars = 10f;

2. Grid

Our bars are vertical e.g. it is a column chart, so we would like to have a horizontal grid. We set the GridType property to GridType.HorScale and we set the AltGridBrush and GridBruh to different gray colors to give us nice alternating grid stripes. For the outlining of the whole plot area we use the PlotAreaOutlinePen.

    //grid settings
    BarChart1.GridBrush= new MindFusion.Drawing.SolidBrush(System.Drawing.Color.FromArgb(242, 239, 224));
    BarChart1.GridPen= new MindFusion.Drawing.Pen(System.Drawing.Color.FromArgb(204, 196, 185));
    BarChart1.GridType = MindFusion.Charting.GridType.HorScale;
    BarChart1.PlotAreaOutlinePen = new MindFusion.Drawing.Pen(System.Drawing.Color.FromArgb(204, 196, 185));

3. Labels Inside Bars

The labels inside bars show the data of each bar – this is done by setting the InnerLabelType property to LabelType.Data. We use a white LabelBrush to draw the labels and set their InnerLabelBorder to Border.RoundedRect. The background of the inner labels is set to gray.

    //inner labels settings
    BarChart1.InnerLabelBackground = new MindFusion.Drawing.SolidBrush(System.Drawing.Color.FromArgb(112, 128, 144));
    BarChart1.InnerLabelBorder = MindFusion.Charting.Border.RoundedRect;
    BarChart1.InnerLabelType = MindFusion.Charting.LabelType.Data; 
    BarChart1.LabelBrush = new MindFusion.Drawing.SolidBrush(System.Drawing.Color.FromArgb(255, 255, 255));

4. Title

We want not only title but also second title – or a subtitle. That’s why we use both the TitleText and SubTitleText properties. We leave no distance between them – we set SubTitleOffset to 0. But we would like the two titles to be well above the plot area, that’s why we set bigger TitleOffset.

    //title and subtitle
    BarChart1.SubTitleOffset = 30;
    BarChart1.SubTitleText = "all major continents";
    BarChart1.TitleOffset = 0;
    BarChart1.TitleText = "Sales";

5. Labels at the Axes

The X-labels are custom text – we set them with XLabels. The title of the Y-axis is rotated, so we use LabelOrientation.BottomToTop.

    //axes labels settings
    BarChart1.XAxisSettings.LabelSeriesIndex = 1;
    BarChart1.XLabels.Clear();
    BarChart1.XLabels.Add(new List(){ "Europe", "Asia", "North America", "South America"});
    
    BarChart1.YAxisSettings.TitleLabel = "in mlns. USD";
    BarChart1.YAxisSettings.TitleLabelOrientation = MindFusion.Charting.LabelOrientation.BottomToTop;

Here is a screenshot of the final chart:

ASP.NET Bar Chart with Custom Labels

ASP.NET Bar Chart with Custom Labels

The sample can be downloaded from here:

Download ASP.NET Bar Chart with Labels Sample

The trial version of MindFusion.Charting for ASP.NET can be downloaded directly from the link below. It contains many more samples and tutorials:

Download MindFusion.Charting for WebForms Trial Version

About MindFusion.Charting for WebForms: A powerful WebForms control that lets programmers add compelling charts in any ASP.NET application. With the component you can design and create any bar, column, line, area, scatter, bubble, radar, polar, doughnut and pie chart. Its elegant API includes data binding, themes, hit-testing, zoom, drill-down, wizards and many more.

The control takes advantage of the rich capabilities of Microsoft WebForms but its functionality does not bring excess complexity. The API is very easy to understand, all the features are duly documented. Numerous samples and step-by-step tutorials let you learn quickly how to tailor the tool in order to meet best your needs.

Details about the various features of the control are provided here. The online demo will give you an overview of the control’s rich capabilities. Licenses, prices and discounts are listed at the buy page.