MindFusion has just released a new version of its Diagramming component for ActiveX. Here is an overview of the new features:
Resize of multiple nodes
You can resize multiple selected nodes simultaneously – just set the AllowMultipleResize property to true. When enabled, dragging a corner or side adjustment handle of any node resizes all nodes in the selection.
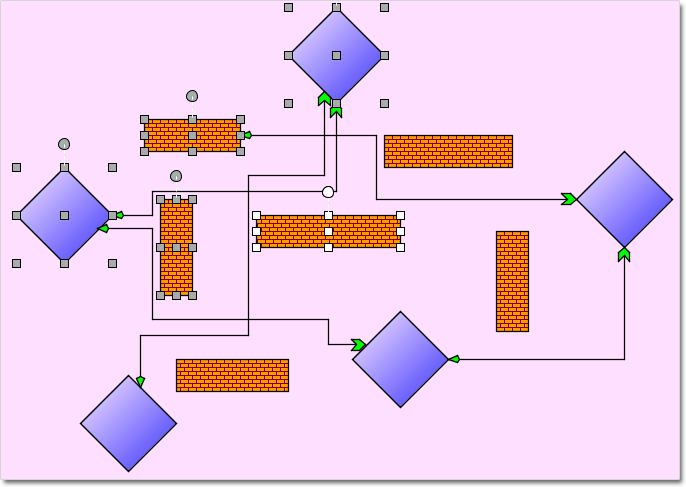
Multiple nodes can be resized simultaneously.
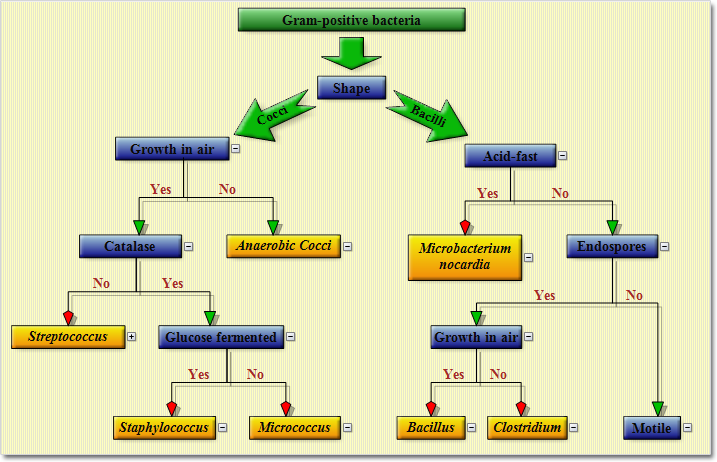
Decision flowchart layout
DecisionLayout arranges simple flowcharts consisting of decision boxes with up to three outgoing links per node and activity boxes with a single outgoing link per node. The nodes are arranged in columns and rows, whose distance depends on the HorizontalPadding and VerticalPadding property values. When links share the same row or column, they are placed at a distance specified via LinkPadding. The layout arranges nodes recursively starting from StartNode. The layout algorithm is available only in the professional edition of the control.
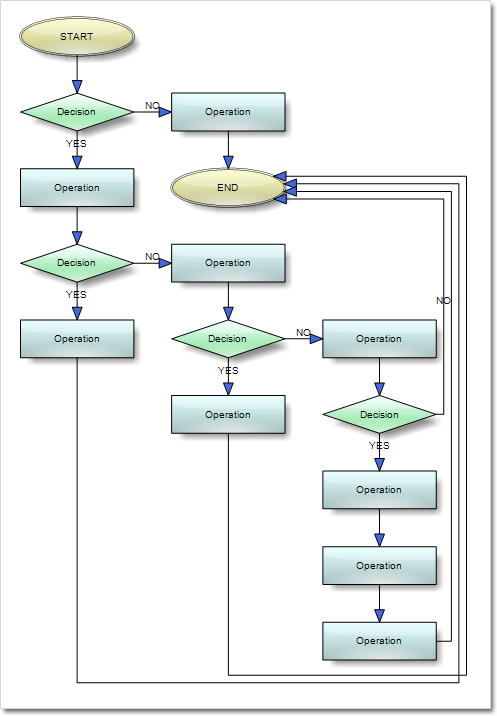
The decision flowchart layout.
You can read further details about the new features and this release of FlowChartX at the news section of the forum. The trial version of the control is available for download from here:
Download FlowChartX 4.9 Trial Version
Technical support
MindFusion puts special effort in providing excellent customer support to all developers who use our components. You can write at the forum, help desk or use e-mail support@mindfusion.eu. All questions are usually answered within hours of being received.
About MindFusion.Diagramming for ActiveX: An ActiveX programming component that lets you create with ease every type of diagram, flowchart, scheme, chart, hierarchy, tree etc. The control supports rich user interaction model with advanced features like tool tips, grid alignment, docking points for nodes, scrolling and zooming and many more. FlowChartX implements 7 automatic layouts as well arrow routing. The appearance if each flowchart is completely customizable. Nodes can hold both images and text, their Z-order can be changed and there are tens of predefined shapes to choose from. Nodes support aero and glass visual effects.
The control also includes detailed documentation and many samples for a variety of languages and
platforms. You can find more about the features of the tool at the features page or check the licensing scheme and the prices here.