Creating custom CompositeNode components

In this post we’ll examine how CompositeNode components work in MindFusion.Diagramming for Windows Forms, and in the process create a custom radio button component. You can find the completed sample project here: RadioComponent.zip

CompositeNode was created as alternative of the ControlNode class, which lets you present any Windows Forms control as a diagram node. ControlNode has many advantages, such as letting you design the hosted user controls using Visual Studio designer, reusing them in other parts of the user interface, and including complex framework or third-party controls as their children. From the fact that each user control creates a hierarchy of Win32 windows come some disadvantages too:

  • ControlNodes cannot mix with other diagram elements in the Z order but are always drawn on top
  • performance deteriorates if showing hundreds of nodes
  • mouse events might not reach the diagram if hosted controls capture mouse input
  • print and export might not be able to reproduce the appearance of hosted controls without additional work (handling PaintControl event)

On the other hand, CompositeNode does all its drawing in DiagramView control’s canvas and is not affected by the issues listed above. CompositeNode lets you build node’s UI by composing hierarchy of components derived from ComponentBase class. Pre-defined components include layout panels, read-only or editable text fields, images, borders, buttons, check-boxes and sliders. If the UI component you need isn’t provided out of the box, you could still implement it as a custom class that derives from ComponentBase or more specific type and overriding the GetDesiredSize, ArrangeComponents and Draw methods. Lets see how that works using a RadioButtonComponent as an example.

Derive RadioButtonComponent from CheckBoxComponent so we reuse its IsChecked and Content properties:

class RadioButtonComponent : CheckBoxComponent
{
}

CompositeNode relies on a dynamic layout system that lets components determine their size by overriding GetDesiredSize method, and arranging children in allocated size by means of ArrangeComponents method. For radio button we’ll call its base class to measure content size and add enough space for drawing the radio graphics element (a circle) horizontally, while fitting it in measured height:

float RadioSize(SizeF size)
{
	return Math.Min(size.Width, size.Height);
}

public override SizeF GetDesiredSize(SizeF availableSize, IGraphics graphics)
{
	var s = base.GetDesiredSize(availableSize, graphics);
	s.Width += RadioSize(s);
	return s;
}

ArrangeComponents calls the base class to arrange its content on the right side of available space:

public override void ArrangeComponents(RectangleF availableSpace, IGraphics graphics)
{
	var radioSize = RadioSize(availableSpace.Size);
	availableSpace.X += radioSize;
	availableSpace.Width -= radioSize;
	base.ArrangeComponents(availableSpace, graphics);
}

Now override Draw and render standard radio button graphics on the left side of the component, and content on the right side:

public override void Draw(IGraphics graphics, RenderOptions options)
{
	var radioSize = RadioSize(Bounds.Size);
	var r = radioSize / 2 - 1;
	var cr = r - 1;

	graphics.FillEllipse(Brushes.White, Bounds.X + 1, Bounds.Y + 1, 2 * r, 2 * r);
	using (var pen = new System.Drawing.Pen(Color.Black, 0.1f))
		graphics.DrawEllipse(pen, Bounds.X + 1, Bounds.Y + 1, 2 * r, 2 * r);
	if (IsChecked)
		graphics.FillEllipse(Brushes.Black, Bounds.X + 2, Bounds.Y + 2, 2 * cr, 2 * cr);

	GraphicsState s = graphics.Save();
	graphics.TranslateTransform(radioSize - 1 + Bounds.X, Bounds.Y);
	Content.Draw(graphics, options);
	graphics.Restore(s);
}

We’ll want only one radio from a group to be selected. For our purposes we can count all radio buttons placed inside same stack panel as part of same group. Override the OnClick method to unselect all buttons in parent panel and select the clicked one:

protected override void OnClicked(EventArgs e)
{
	var parentStack = Parent as StackPanel;
	if (parentStack != null)
	{
		foreach (var child in parentStack.Components)
		{
			var radio = child as RadioButtonComponent;
			if (radio != null)
				radio.IsChecked = false;
		}
	}
	this.IsChecked = true;
}

That’s it, the radio button component is ready with just a screenful of code 🙂 Let’s check how it works by creating an OptionNode class that shows a group of radio buttons and exposes a property to access or change selected one:

class OptionNode : CompositeNode
{
}

You could create the stack panel and radio buttons from code if you need more dynamic configuration, e.g. one with variable number of radio buttons. For this example we’ll just load a fixed template consisting of four buttons from XML:

const string Template = @"
	<simplepanel>

        <shape name="" shape""="" shape="" roundrect""="">

		<border padding="" 2""="">

			<stackpanel name="" radiogroup""="" orientation="" vertical""="" spacing="" 1""="" horizontalalignment="" center""="">
				<radiobuttoncomponent padding="" 2""="">
					<radiobuttoncomponent.content>
						<text text="" option="" 1""="" font="" verdana,="" 3world,="" style="Bold&quot;&quot;">
					</text></radiobuttoncomponent.content>
				</radiobuttoncomponent>
				<radiobuttoncomponent padding="" 2""="">
					<radiobuttoncomponent.content>
						<text text="" option="" 2""="" font="" verdana,="" 3world,="" style="Bold&quot;&quot;">
					</text></radiobuttoncomponent.content>
				</radiobuttoncomponent>
				<radiobuttoncomponent padding="" 2""="">
					<radiobuttoncomponent.content>
						<text text="" option="" 3""="" font="" verdana,="" 3world,="" style="Bold&quot;&quot;">
					</text></radiobuttoncomponent.content>
				</radiobuttoncomponent>
				<radiobuttoncomponent padding="" 2""="">
					<radiobuttoncomponent.content>
						<text text="" option="" 4""="" font="" verdana,="" 3world,="" style="Bold&quot;&quot;">
					</text></radiobuttoncomponent.content>
				</radiobuttoncomponent>
			</stackpanel>

		</border>

    </shape></simplepanel>";

The template can be loaded using the XmlLoader class. We’ll also store a reference to the stack panel so we can access its child radio buttons:

public OptionNode()
{
	Load();
}

public OptionNode(Diagram d)
	: base(d)
{
	Load();
}

private void Load()
{
	Components.Add(XmlLoader.Load(Template, this, null));

	radioGroup = FindComponent("RadioGroup") as StackPanel;
}

StackPanel radioGroup;

Now implement a SelectedOption property that lets us select a radio button by its index. Define it as nullable integer so we can represent missing select too:

public int? SelectedOption
{
	get
	{
		for (int i = 0; i < radioGroup.Components.Count; i++)
		{
			var radioButton = (RadioButtonComponent)radioGroup.Components[i];
			if (radioButton.IsChecked)
				return i;
		}
		return null;
	}
	set
	{
		for (int i = 0; i < radioGroup.Components.Count; i++)
		{
			var radioButton = (RadioButtonComponent)radioGroup.Components[i];
			radioButton.IsChecked = value == i;
		}
	}
}

Let’s try it – create a few nodes and run the application, you’ll see the screen shown below:

var node1 = new OptionNode();
node1.Bounds = new RectangleF(20, 20, 30, 40);
node1.SelectedOption = 0;
diagram.Nodes.Add(node1);

var node2 = new OptionNode();
node2.Bounds = new RectangleF(90, 20, 30, 40);
node2.SelectedOption = 1;
diagram.Nodes.Add(node2);

var node3 = new OptionNode();
node3.Bounds = new RectangleF(20, 80, 30, 40);
node3.SelectedOption = null;
diagram.Nodes.Add(node3);

var node4 = new OptionNode();
node4.Bounds = new RectangleF(90, 80, 30, 40);
node4.SelectedOption = 3;
diagram.Nodes.Add(node4);

for (int i = 0; i < diagram.Nodes.Count - 1; i++)
	diagram.Factory.CreateDiagramLink(
		diagram.Nodes[i], diagram.Nodes[i + 1]);
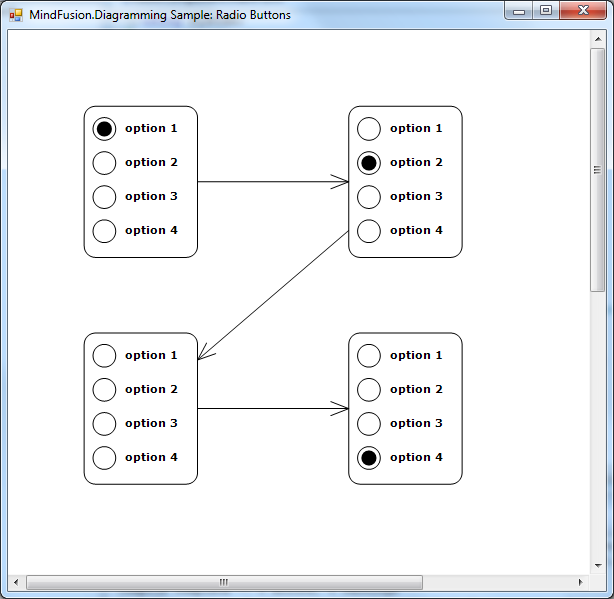
Radio buttons in MindFusion diagram nodes

To be fair, this kind of nodes is simple enough to implement using standard TableNode class where radio button graphics are either custom drawn or set as Image inside table cells in first column, and text displayed in second column. However the radio buttons can be mixed with other components in CompositeNodes to implement more complex user interfaces than ones possible with tables.

For more information on MindFusion flow diagramming libraries for various desktop, web and mobile platforms, see MindFusion.Diagramming Pack page.

Enjoy!

Diagramming for JavaScript, V2.5

The new release of MindFusion Diagramming library for JavaScript contains some useful new features and improvements. Below are the details:

Resize of table columns and rows

Columns and rows of a TableNode can now be resized interactively if its AllowResizeColumns or AllowResizeRows properties are enabled. In order to resize, move the mouse pointer to the border line on column’s right side or row’s bottom side until it shows resize cursor and start dragging. The control raises tableColumnResizing and tableRowResizing events to let you validate new size or prevent resizing some elements. The tableColumnResized and tableRowResized events are raised after the operation completes.

JavaScript Table Nodes: Resize

JavaScript Table Nodes: Resize

Shape libraries

The ShapeLibrary class lets you use custom geometric shapes created using MindFusion ShapeDesigner tool. Call its loadFromXml method to load a library XML file. getShapes returns an array of the loaded Shape objects. The ShapeLibraryLocation property of NodeListView creates a prototype ShapeNode object for each shape from the specified library.

Miscellaneous

  • TextStroke and TextStrokeThickness properties of DiagramItem let you set color and thickness of text outlines.
  • Items can now be deleted using Backspace key when running on Mac.
  • Caption divider line in TableNode and ContainerNode is now rendered clipped when caption height is smaller than corner radius.
  • The TooltipDelay property specifies the delay in milliseconds before showing tooltips.
  • The Orientation property of NodeListView lets you set the view’s orientation to Horizontal or Vertical .
  • MindFusion.Common.js contains code shared with other JavaScript libraries by MindFusion. It must be loaded before the MindFusion.Diagramming.js script.

Fixed bugs

  • Fixed overlaps in TreeLayout when arranging nodes of different sizes.
  • Anchor points indices were not serialized and could be reset to different values when loading from JSON.
  • Deserialization of custom item classes worked correctly only if their names contained Node or Link suffix.

Registered customers with an active upgrade subscription can download the licensed version from the clients area on our site.

A trial version is available for direct download from the following link:

Download MindFusion Diagramming Library for JavaScript, V2.5

We are glad to receive any comments, suggestions and feedback. You can write us at e-mail support@mindfusion.eu or use the help desk. You can use the JsDiagram section on MindFusion forum to post questions about the tool.

About Diagramming for JavaScript Library: Written 100% in JavaScript, this tool uses HTML5 Canvas to draw impressive diagrams, schemes, flowcharts, trees and many more. It is browser independent, easy to use and integrate into any web application. JsDiagram supports a variety of predefined node shapes, customizable links, rich event set and many appearance options.

The user interaction model includes resizing / moving / selecting and modifying any diagram element. The tool boasts an elegant API, which is documented in details as well numerous step-by-step guides and tutorials. Various samples are provided to let you learn quickly how to use the most important features of the library – check them here. JsDiagram is not only the perfect choice for creating any type of diagram in the browser – it can also arrange it the way you wish with a mouse click using one of its automatic graph layout algorithms. For more details about the features of the component, please visit the Diagram for JavaScript page.

Diagramming for WinForms, V6.3.4 Released

MindFusion popular diagram control for WinForms has a new version. Here is a list of the new features:

Street maps

MapNodes can render street maps in OpenStreetMap format. Call FromXml method of MapContent to load an .osm file. The pens and brushes used for drawing the map are stored within the StreetMapPens and StreetMapBrushes collections in the static StreetMapFeatures class. You can define additional pens and brushes for drawing and painting certain map features by using MapContent’s AddPen and AddBrush methods.

Diagramming for WinForms: Map Nodes

Diagramming for WinForms: Map Nodes

Miscellaneous

  • Support for .NET 2 has been dropped; the minimum supported .NET framework version now is 3.5.
  • Distribution now includes a set of digitally-signed assemblies.
  • Undo/redo records for in-place edit operations are now created automatically. They are represented by instances of the EditTextCmd class.
  • CompositeNode supports vertical scrolling in EditComponent (only via keyboard).
  • Support for FromPage and ToPage properties of PrinterSettings.
  • CreateBarcodeNode methods added to the Factory class.
  • The BarcodeNodeStyle property of Diagram defines the default appearance of BarcodeNodes.
  • Improved speed when dragging large hierarchies of grouped nodes.
  • Fix for not restoring ColumnStyle value when cancelling or undoing TableNode column resize operations.

The trial version is available for direct download from the link below:

Diagramming for WinForms, V6.3.4 Trial Version Download

Your comments and feedback about the new version is welcomed. You can use the Diagramming for WinForms forum, the help desk or write us at support@mindfusion.eu. Our support team will be pleased to help you.

About MindFusion.Diagramming for WinForms: A programming component that provides any WinForms application with a full set of features for creating and customizing all types of diagrams, flowcharts, schemes, hierarchies, trees, graphs etc. The control provides numerous ways to save and load a diagram, six auxiliary controls and more than 12 automatic graph layout algorithms. Diagram elements include scrollable tables, container nodes, multi-segment arrows, custom diagram item types and many more. Further details here.

Diagramming for WinForms is a royalty-free component, clients get 12 month upgrade subscription when buying a license. The source code is also available for purchase. Visit the buy page for a list with the current license prices.

Diagramming for ActiveX, V4.9.2 Beta

We are running beta tests on the new version of MindFusion ActiveX Flowchart Control. Below is a list of the new features and add-ons:

Resize table columns and rows
Columns and rows of a Table node can now be resized interactively if its AllowResizeColumns or AllowResizeRows properties are enabled. In order to resize, move the mouse pointer to the border line on column’s right side or row’s bottom side until it shows resize cursor and start dragging. The control raises TableColumnResized and TableRowResized events when the operation completes.

License keys
There is no separate trial build of the control’s libraries anymore. Instead, set the LicenseKey property to disable the component’s evaluation mode and stop displaying trial messages. License key strings are now listed on the Keys & Downloads page at MindFusion’s customer portal. Keys for MindFusion.Diagramming Pack will now work for ActiveX control too.

Miscellaneous

  • Table nodes can be roots of collapsible tree branches too. The Table class now provides Expandable and Expanded properties, and Expand and Collapse method. The control raises TableCollapsed and TableExpanded events when a table-rooted branch is collapsed or expanded.
  • SvgExporter.ExportString method returns a string containing the SVG markup;
  • fixed crash in integrated SvgExporter;

If you are interested in testing the beta version, please download this archive containing the control’s dll file:

https://mindfusion.eu/_beta/fcx492.zip

Technical support
MindFusion puts special effort in providing excellent customer support to all developers who use our components. You can write at the forum, help desk or use e-mail support@mindfusion.eu. All questions are usually answered within hours of being received.

About MindFusion.Diagramming for ActiveX: An ActiveX programming component that lets you create with ease every type of diagram, flowchart, scheme, chart, hierarchy, tree etc. The control supports rich user interaction model with advanced features like tool tips, grid alignment, docking points for nodes, scrolling and zooming and many more. FlowChartX implements 7 automatic layouts as well arrow routing. The appearance if each flowchart is completely customizable. Nodes can hold both images and text, their Z-order can be changed and there are tens of predefined shapes to choose from. Nodes support aero and glass visual effects.

The control also includes detailed documentation and many samples for a variety of languages and platforms. You can find more about the features of the tool at the features page or check the licensing scheme and the prices here.

Display Petri nets using MindFusion diagram component.

In this post we show how to build a Petri net using MindFusion.Diagramming for WinForms. Petri nets are used to model and study distributed systems. A net contains places, transitions and arcs. A place represents possible state of the system, and a transition represents the change from one state to another. Arcs connect places to transitions and show the flow direction.

First, create a new .NET Windows Forms project and add a Model.cs file to it where we’ll define Petri net model classes

public class Net
{
	public List Places { get; set; }
	public List Transitions { get; set; }
	public List Arcs { get; set; }

	public Net()
	{
		Places = new List();
		Transitions = new List();
		Arcs = new List();
	}
}

public class Node
{
	public string Label { get; set; }
}

public class Place : Node
{
	public int Tokens { get; set; }
}

public class Transition : Node
{
}

public class Arc
{
	// Arcs run from a place to a transition or vice versa,
	// never between places or between transitions.

	public Arc(Place input, Transition output)
	{
		Input = input;
		Output = output;
	}

	public Arc(Transition input, Place output)
	{
		Input = input;
		Output = output;
	}

	public Node Input { get; private set; }
	public Node Output { get; private set; }

	public int Multiplicity { get; set; }
}

Now we can create a simple Petri net:

Net CreateSampleNet()
{
	var net = new Net();

	var p1 = new Place { Label = "P1", Tokens = 1 };
	var p2 = new Place { Label = "P2", Tokens = 0 };
	var p3 = new Place { Label = "P3", Tokens = 2 };
	var p4 = new Place { Label = "P4", Tokens = 1 };

	net.Places.AddRange(new[] { p1, p2, p3, p4 });

	var t1 = new Transition { Label = "T1" };
	var t2 = new Transition { Label = "T2" };

	net.Transitions.AddRange(new[] { t1, t2 });

	var a1 = new Arc(p1, t1);
	var a2 = new Arc(t1, p2);
	var a3 = new Arc(t1, p3);
	var a4 = new Arc(p2, t2);
	var a5 = new Arc(p3, t2);
	var a6 = new Arc(t2, p4);
	var a7 = new Arc(t2, p1);

	net.Arcs.AddRange(new[] { a1, a2, a3, a4, a5, a6, a7 });

	return net;
}

Next, drop a DiagramView and Diagram objects on the form which we’ll use to visualize the net. Add the following method to create diagram elements representing the model objects, and run LayeredLayout to arrange them:

void BuildDiagram(Net net)
{
	var nodeMap = new Dictionary<node, diagramnode="">();

	var placeBounds = new RectangleF(0, 0, 16, 16);
	var transBounds = new RectangleF(0, 0, 6, 20);

	foreach (var place in net.Places)
	{
		var node = diagram.Factory.CreateShapeNode(placeBounds);
		node.Text = place.Label;
		node.TextFormat.LineAlignment = StringAlignment.Far;
		node.Shape = Shapes.Ellipse;
		node.Tag = place.Tokens;
		node.CustomDraw = CustomDraw.Additional;
		nodeMap[place] = node;
	}

	foreach (var trans in net.Transitions)
	{
		var node = diagram.Factory.CreateShapeNode(transBounds);
		node.Text = trans.Label;
		node.TextFormat.LineAlignment = StringAlignment.Far;
		node.Shape = Shapes.Rectangle;
		nodeMap[trans] = node;
	}

	foreach (var arc in net.Arcs)
	{
		var link = diagram.Factory.CreateDiagramLink(
			nodeMap[arc.Input], nodeMap[arc.Output]);
		link.Tag = arc.Multiplicity;
		link.HeadShape = ArrowHeads.PointerArrow;
	}

	var layout = new LayeredLayout();
	layout.Orientation = Orientation.Horizontal;
	layout.StraightenLongLinks = true;
	layout.Arrange(diagram);
}</node,>

We will use the DrawNode custom draw event to render marks associated with each place. Another possibility is to create a custom node class and override its Draw method.

void OnDrawNode(object sender, DrawNodeEventArgs e)
{
	var node = e.Node;
	var g = e.Graphics;

	if (node.Tag is int)
	{
		var tokens = (int)node.Tag;
		var cx = node.Bounds.Width / 2;
		var cy = node.Bounds.Height / 2;

		if (tokens == 1)
		{
			float r = cx / 2;
			DrawMark(cx, cy, r, g);
		}
		else if (tokens == 2)
		{
			float r = 2 * cx / 5;
			DrawMark(cx / 2, cy, r, g);
			DrawMark(3 * cx / 2, cy, r, g);
		}
		else if (tokens == 3)
		{
			float r = cx / 3;
			float y2 = 4 * cy / 3;
			DrawMark(cx, 2 * cy / 5, r, g);
			DrawMark(cx / 2, y2, r, g);
			DrawMark(3 * cx / 2, y2, r, g);
		}
	}
}

void DrawMark(float x, float y, float r, IGraphics g)
{
	g.FillEllipse(Brushes.Black, x - r, y - r, r * 2, r * 2);
}

Finally, set some appearance properties and call the methods above to build the diagram:

public MainForm()
{
	InitializeComponent();

	diagram.ShadowsStyle = ShadowsStyle.None;
	diagram.DiagramLinkStyle.Brush = new MindFusion.Drawing.SolidBrush(Color.Black);
	diagram.ShapeNodeStyle.Brush = new MindFusion.Drawing.SolidBrush(Color.White);
	diagram.ShapeNodeStyle.FontSize = 10f;
	diagram.ShapeNodeStyle.FontStyle = FontStyle.Bold;

	var textAbove = new[]
	{
		new LineTemplate(-100, -100, 200, -100),
		new LineTemplate(200, -100, 200, 0),
		new LineTemplate(200, 0, -100, 0),
		new LineTemplate(-100, 0, -100, -100)
	};
	Shapes.Ellipse.TextArea = textAbove;
	Shapes.Rectangle.TextArea = textAbove;

	var net = CreateSampleNet();
	BuildDiagram(net);
}

The final result is displayed below.
Petri net diagram

The complete sample project is available for download here:
PetriNet.zip

For more information on Petri nets, see this Wikipedia article:
http://en.wikipedia.org/wiki/Petri_net

All MindFusion.Diagramming libraries expose the same programming interface, so most of the sample code shown above will work with only a few modifications in WPF, ASP.NET, Silverlight and Java versions of the control.

Enjoy!