In this post we’ll show how to use TableNode objects to display tabular data, more specifically database schema information. A Visual Studio sample project containing the code from this post is available for download here:
To start, create a new Windows Forms application, and place a text field for connection string, a button and a DiagramView on the form. In the code-behind file, add following field to map table name to respective TableNode objects:
Dictionary<string, tablenode=""> tables = new Dictionary<string, tablenode="">();
</string,></string,>
Add a RectangleF that stores default size passed to CreateTableNode method:
RectangleF defaultSize = new RectangleF(0, 0, 30, 30);
Create a ReadTables method, which provided an SqlConnection, parses its schema information and creates diagram nodes:
void ReadTables(SqlConnection connection)
{
	// get table schema definitions from connection
	var schema = connection.GetSchema("Tables");
	foreach (DataRow row in schema.Rows)
	{
		// fetch table name
		var name = row["TABLE_NAME"].ToString();

		// create respective node
		var table = diagram.Factory.CreateTableNode(defaultSize);
		table.Caption = name;
		table.Shape = SimpleShape.RoundedRectangle;
		table.Brush = new MindFusion.Drawing.SolidBrush(Color.LightGray);

		// register node in dictionary for future foreign key reference
		tables[name.Replace(" ", "_")] = table;
		ReadFields(table, connection,
			row["TABLE_CATALOG"].ToString(), null, name);
	}

	ReadForeignKeys(connection);
}
The ReadFields method takes table node and name parameters and creates node cells that will show information for the column name and type of database tables:
void ReadFields(TableNode node,
	SqlConnection connection, string db, string owner, string tableName)
{
	// remove default cells
	node.RowCount = 0;

	// reserve one column for name and one for data type
	node.ColumnCount = 2;

	// read column definitions of specified table
	var schema = connection.GetSchema("Columns", new[] { db, owner, tableName });
	foreach (DataRow row in schema.Rows)
	{
		// add a new row to the node
		int r = node.AddRow();

		// set cells' text to the column name and type
		node[0, r].Text = row["COLUMN_NAME"].ToString();
		node[1, r].Text = row["DATA_TYPE"].ToString();

	}

	// make table cells big enough to show all text
	node.ResizeToFitText(false);
}
The ReadForeignKeys method creates DiagramLink connectors between table nodes to show the relationships between database tables:
void ReadForeignKeys(SqlConnection connection)
{
	var schema = connection.GetSchema("ForeignKeys");
	foreach (DataRow row in schema.Rows)
	{
		// read foreign key information
		string fkName = row["CONSTRAINT_NAME"].ToString();
		string tableName = row["TABLE_NAME"].ToString().Replace(" ", "_");
		string prefix = "FK_" + tableName + "_";
		if (fkName.StartsWith(prefix))
		{
			string targetName = fkName.Substring(prefix.Length);

			// get table nodes registered for specified names
			if (tables.ContainsKey(targetName) && tables.ContainsKey(tableName))
			{
				var table = tables[tableName];
				var targetTable = tables[targetName];

				// create a link between the nodes to show relationship
				diagram.Factory.CreateDiagramLink(table, targetTable);
			}
		}
	}
}
Finally handle the button’s click event to open specified connection and call ReadTables. Apply AnnealLayout to arrange the tables so that they do not overlap:
private void btnOpen_Click(object sender, System.EventArgs e)
{
	diagram.ClearAll();

	try
	{
		var connection = new SqlConnection(tbConnection.Text);
		connection.Open();

		// read schema and create corresponding diagram items
		ReadTables(connection);

		connection.Close();
	}
	catch (Exception exception)
	{
		MessageBox.Show(exception.Message);
		diagram.ClearAll();
	}

	// arrange the tables to remove overlaps
	var layout = new AnnealLayout();
	layout.SplitGraph = true;
	layout.Randomize = false;
	layout.MultipleGraphsPlacement = MultipleGraphsPlacement.MinimalArea;
	layout.Margins = new SizeF(10, 10);
	layout.Arrange(diagram);
}
If you run the project and open the Northwind sample database by Microsoft, you should see this diagram:
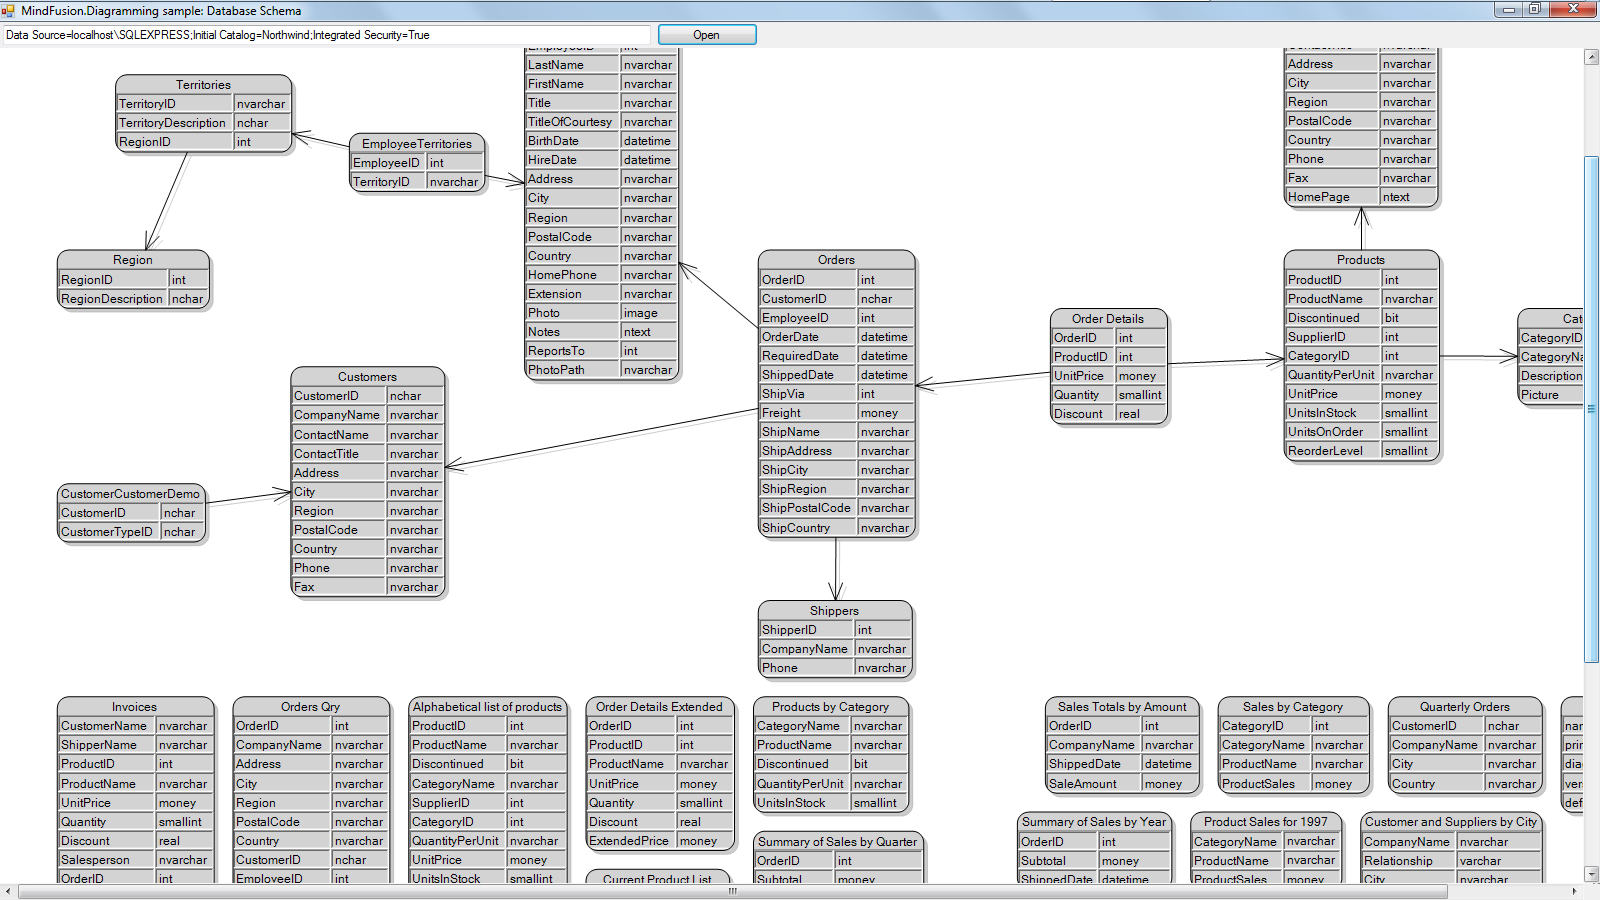
The code above uses MindFusion’s .NET API and can be used with Windows Forms, WPF, Silverlight and ASP.NET diagramming components. The Java API for Android and desktop Swing application will look similar, with setter method calls instead of property assignments.
You can download the trial version of any MindFusion.Diagramming component from this page.
Enjoy!