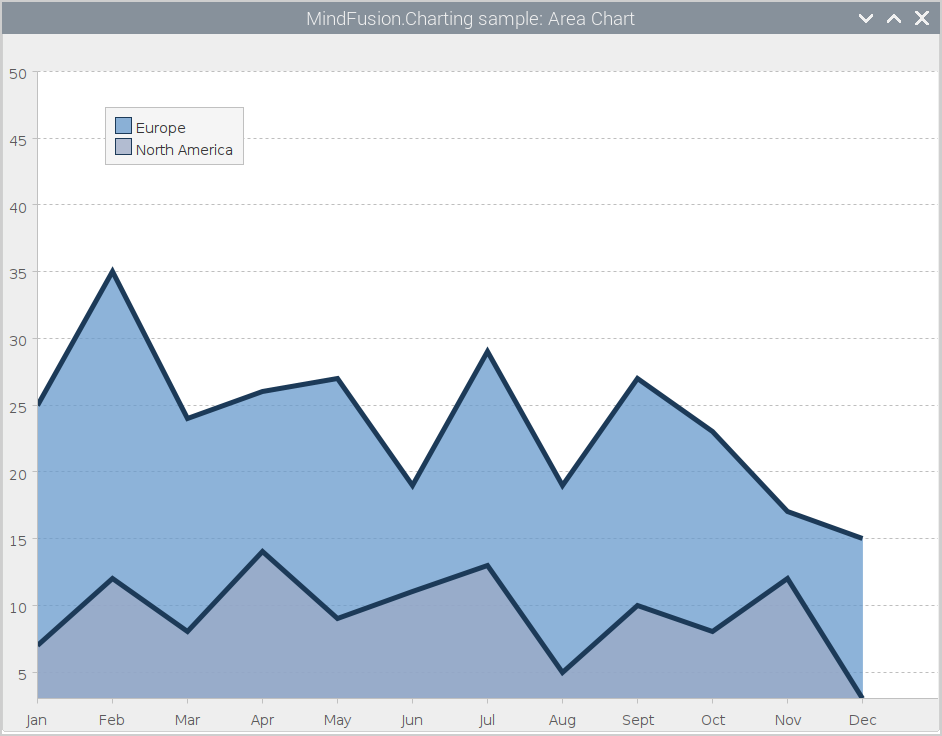
In this blog post we are going to show you how to build this beautiful area chart with two series. We use MindFusion charting library for Java Swing and the AreaChart control that is part of it.

In this blog post we are going to show you how to build this beautiful area chart with two series. We use MindFusion charting library for Java Swing and the AreaChart control that is part of it.
In this blog post we will explain how to color cells and resources in the Resource view of the calendar based on a certain criteria. In our case we take the “Resource Table” sample from the Samples for the Java Swing Scheduler and we will edit its code to color the header and background of cells that correspond to given resources, in our sample it is an employee:

We will also add tooltips that show when the mouse is over cells that correspond to this employee:

We will build a diagram with 50 random nodes and we will zoom and pan this diagram programmatically. Here is a screenshot of the final diagram, which is a link to the sample:

We will use the MindFusion Diagramming library for JavaScript.
I. Project Setup
We add a reference to the MindFusion.Diagramming.js and MindFusion.Common.js files. We also add a reference to another file called MouseEvents.js. This is our code-behind file.
<script src="MindFusion.Common.js" type="text/javascript"></script>
<script src="MindFusion.Diagramming.js" type="text/javascript"></script>
<script src="MouseEvents.js" type="text/javascript"></script>
In the BODY of the web page we create a Canvas element, to which we assign an id. This is important, because we will refer to the Canvas in code:
<div style="width: 100%; height: 100%; overflow: auto;">
    <canvas id="diagram_canvas" width="2100" height="2100">
        This page requires a browser that supports HTML 5 Canvas element.
    </canvas>
</div>
II. Diagram Settings
In the code-behind file that we called MouseEvents.js we use the DOMContentLoaded event to initialize the diagram.
document.addEventListener("DOMContentLoaded", function ()
{
    // create a Diagram component that wraps the "diagram_canvas" canvas
    diagram = MindFusion.AbstractionLayer.createControl(Diagram, null, null, null, document.getElementById("diagram_canvas"));
    diagram.setBounds(new Rect(5, 5, 2000, 1000));
We use the createControl method of the AbstractionLayer class to create an instance of the Diagram class. The setBounds method determines the size of the diagram’s drawing area. If this size is bigger than the size of the Canvas, the diagram automatically shows scrollbars. Note that only if the diagram’s area is larger than the canvas we can use panning.
We use some settings of the Diagram class to customize the application:
diagram.setDefaultShape("Rectangle");
diagram.setRouteLinks(true);
diagram.setRoundedLinks(true);
diagram.setShowGrid(false);
The links will be routed and rounded and no grid will be rendered.
III. Diagram Items
We create the diagram nodes with the createShapeNode method of the Factory class. The Factory class as an instance is available through the getFactory() method:
for(var i = 0; i < 50; i++)
    {
        var colorIndex = Math.floor(Math.random() * 3);
        var shape = diagram.getFactory().createShapeNode(new Rect(136, 36, 20, 10));
        shape.setBrush({ type: 'SolidBrush', color: colors[colorIndex] });
        if(i % 3   == 0)
            shape.setShape('Ellipse');
        else
            shape.setShape('Rectangle');
        if( i % 7 == 0)
        {
            shape.setBounds(new Rect(136, 36, 16, 8));
        }

        shape.setText("Node " + (i + 1).toString());
        shape.setTextColor("white");
    }
We make each third shape Ellipse and we choose the brush on a random principle out of three brushes, that we initialized in an array. Each seventh shape is slightly smaller – that is set with the setBounds method, which takes as an argument a Rect, that is slightly smaller than the Rect instance that we use when we create the shape nodes.
The connectors among the nodes are created with the createDiagramLink method of Factory . We cycle through all 50 nodes and connect each one of them with a randomly taken node from the diagram nodes collection. This collection is available through the nodes proeprty of the Diagram class:
diagram.nodes.forEach(function(node)
{
    var nodeIndex = Math.floor(Math.random() * 50);

    var node2 = diagram.nodes[nodeIndex];
    var link = diagram.getFactory().createDiagramLink(node, node2);
    link.setHeadShape("Circle");
})
We customize the appearance of the link through the setHeadShape method. We choose the ‘Circle’ shape as a head to each link.
We have created the diagram items with the same bounds, which means they are on top of each other. The best way to arrange them is with one of the automatic layout algorithms, available with the JsDiagram. They are members of the MindFusion.Graphs namespace – you can check the rest. In our sample we’ve chosen the LayeredLayout ,which provides quite nice result. We set its direction to LayoutDirection .There a few other properties that we’ve set that regulate the node distance, the layer distance and more:
var layout = new MindFusion.Graphs.LayeredLayout();
layout.direction = MindFusion.Graphs.LayoutDirection.LeftToRight;
layout.siftingRounds = 0;
layout.nodeDistance = 8;
layout.layerDistance = 8;
diagram.arrange(layout);
All layouts are applies through the arrange method of the Diagram that takes an instance of the layout as an argument.
IV. Pan and Zoom
We will implement pan and zoom by handling standard DOM events. The first one is the “wheel” event, which we attach to the diagram canvas element:
var dgrm = document.getElementById('diagram_canvas');

dgrm.addEventListener('wheel', function(e)
{
    var zoom = diagram.getZoomFactor();
    zoom -= e.deltaY / 10;
    if (zoom > 10)
        diagram.setZoomFactor(zoom);

    e.preventDefault(); // do not scroll
});
We use the getZoomFactor and setZoomFactor methods of the Diagram , to manipulate the zoom ratio. The zoom step is calculated based on the deltaY value of the event args. You can command the amount of zoom by dividing by a smaller or a larger number. It is important that we call preventDefault() on the event arguments, to surpass the default response of the canvas to the wheel event.
The panning is implemented by handling the mousedown and mouseup DOM events of the Canvas.
/* events fired on the draggable target */
dgrm.addEventListener('mousedown', function(e)
{
 if( e.ctrlKey)
	diagram.setBehavior(MindFusion.Diagramming.Behavior.Pan);

}, false);

dgrm.addEventListener('mouseup', function(e)
{
 if( e.ctrlKey)
	diagram.setBehavior(MindFusion.Diagramming.Behavior.LinkShapes);

}, false);
If we want to make the Diagram pan we need simply to change the diagram’s behavior with the setBehavior method. The options are members of the Behavior enumeration. When the user clicks on the Diagram and the Ctrl key is pressed, we change the diagram’s behavior to “Pan”. When the mouse is up, but the Ctrl key is pressed, we rest the behavior back to LinkShapes. This is the default behavior, where dragging with the mouse creates new shapes, while dragging between existing DiagramShape -s, creates DiagramLink -s.
With that our sample is ready. You can download the source code from this link:
Download the Mouse Events Sample with JavaScript Diagram
Technical support is available through MindFusion forum here.
About Diagramming for JavaScript: This native JavaScript library provides developers with the ability to create and customize any type of diagram, decision tree, flowchart, class hierarchy, graph, genealogy tree, BPMN diagrams and much more. The control offers rich event set, numerous customization options, animations, graph operations, styling and themes. You have more than 100 predefined nodes, table nodes and more than 15 automatic layout algorithms. Learn more about Diagramming for JavaScript at https://mindfusion.eu/javascript-diagram.html.
Most tree structures are built as hierarchies: the number of nodes increases at each level. In our sample we will look at a tree, where not all branches have a higher number of nodes than their predecessors. In our tree some nodes will have multiple parents e.g. there are nodes that have several ancestors.
You can try the sample online:

In order to build this application we use MindFusion Diagramming for JavaScript library.
I. General Settings
In a web page we add the code that initializes a Canvas. We give the Canvas an id:
<div style="overflow: visible; height: 100%; margin: 1px; padding: 0px;">
    <canvas id="diagram" width="2100" height="2500">
        This page requires a browser that supports HTML 5 Canvas element.
    </canvas>
</div>
We add references to the two JavaScipt files that provide the diagramming functionality: MindFusion.Diagramming and MindFusion.Common. We also add a reference to a code-behind file that contains the JavaScript code for our application:
<script src="Scripts/MindFusion.Common.js" type="text/javascript"></script>
<script src="Scripts/MindFusion.Diagramming.js" type="text/javascript"></script>
<script src="MultipleParentNodes.js" type="text/javascript"></script>
We have placed those files in a subfolder called Scripts, which is located in our main application folder.
II. Diagram Settings
We create the diagram in the window.onload event handler. We want to be sure that all scripts are loaded:
window.onload = function(e)
{
    var diagramEl = document.getElementById('diagram');
    // create a Diagram component that wraps the "diagram" canvas
    diagram = AbstractionLayer.createControl(Diagram, null, null, null, diagramEl);
    diagram.setAllowInplaceEdit(true);
    diagram.setRouteLinks(true);
    diagram.setShowGrid(true);
    diagram.setRoundedLinks(true);
    diagram.setBounds(new Rect(0, 0, 2000,2500));
}
We create the Diagram using a reference to the DOM element of the Canvas from the web page. We set its allowInplaceEdit property to true, which lets users edit interactively nodes and links. We use showGrid to render a background grid that helps to align nodes and links. We setRoundedLinks and give the diagram a big work are with the setBounds method.
II. Creating the Diagram Nodes
We create the DiagramNode -s in a separate method, which we call after the control is created and all settings are made:
function onLoaded()
{
    var nodes = {};

    for(var i = 0; i < 5; i++)
    {
        nodes[i] = diagram.getFactory().createShapeNode(new Rect(20, 20, 20, 12));
        nodes[i].setShape('Rectangle');
        nodes[i].setBrush({ type: 'SolidBrush', color: '#567939' });
    };
We initialize a list, where we will store dynamically those nodes that we want to have reference to. At first we create 5 ShapeNode -s that are the first level of the tree. We use the createShapeNode method of Factory to create the ShapeNode -s and DiagramLink -s. Note that we will create all nodes with equal bounds. We don’t have to worry about their location because we will apply an automatic layout at the end.
Factory is available through the getFactory method of Diagram You do not usually create the class but get an instance of it through the Diagram instance.
We use setShape to provide the id af the diagram shape that we want the node to take. A list with the diagram shapes available, together with their id-s can be found in the online help.
We also use setBrush to specify the fill of the ShapeNode . In our case we use a SolidBrush ,but there are other options to choose from.
We create then a single ShapeNode that will be the next level:
var node5 = diagram.getFactory().createShapeNode(new Rect(20, 20, 20, 12 ));
node5.setShape('Rectangle');
node5.setBrush({ type: 'SolidBrush', color: '#6f9c49' });
We color it in a slightly lighter shade of green than the nodes at the first level. We then use the Factory class once again to create the DiagramLink -s between the 5 nodes at the first level and this one single node at the second level:
    for(var i = 0; i < 5; i++)
    {
        var link = diagram.getFactory().createDiagramLink(nodes[i], node5);
        link.setHeadShape("Triangle");
        link.setText("20%");
        link.setHeadShapeSize(3.0);
        link.setHeadBrush({ type: 'SolidBrush', color: '#7F7F7F' });
    };
The setText and setHeadShape methods of the DiagramLink class allow us to specify the label of the link and its shape at the end. There is also setBaseShape that allows us the specify the shape at the start of the DiagramLink.
The lovely thing about the Factory class is that it adds automatically the newly created DiagramItem -s, such as nodes and links, to the items collection of the diagram. You can find the newly created DiagramNode -s and DiagramLink -s also as members of the nodes and links collections respectively.
Now we have 5 links coming from all 5 nodes from the first level that point to the second level:
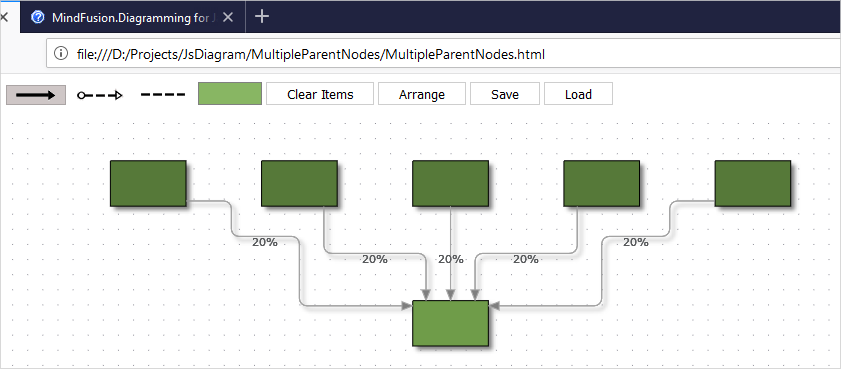
We go on doing the rest of the diagram in the same way. We create ShapeNode -s with Factory and then bind the nodes with Factory .
III. Layout
We use the LayeredLayout to arrange all nodes of the diagram. Since the diagram is not a typical tree, we prefer the LayeredLayout to the TreeLayout
var lLayout = new MindFusion.Graphs.LayeredLayout();
diagram.arrange(lLayout);
It is really easy to apply any other algorithm on the diagram – you just need to create an instance of it and call the arrange method of your diagram to apply this instance. You can quickly change layouts and experiment to see which one provides the best result.
In our case the LayeredLayout looks fine and with this we are done building the tree.
You can download the sample together with all libraries used from the following link:
A JavaScript Graph with Nodes that Have Multiple Parents
Technical support is available through MindFusion forum here.
About Diagramming for JavaScript: This native JavaScript library provides developers with the ability to create and customize any type of diagram, decision tree, flowchart, class hierarchy, graph, genealogy tree, BPMN diagrams and much more. The control offers rich event set, numerous customization options, animations, graph operations, styling and themes. You have more than 100 predefined nodes, table nodes and more than 15 automatic layout algorithms. Learn more about Diagramming for JavaScript at https://mindfusion.eu/javascript-diagram.html.
In this blog post we will use MindFusion JavaScript Diagram library to build an application that allows the users to create a diagram with nodes that hold icons and text. We have used this online diagram application to build an infogram for the services portfolio of an imaginary company. However, you can replace the icons and use it as a tool to build diagrams of whatever domain is of interest to you.
In the sample diagram we use SVG images from Google’s material design icons set. You can download them from https://github.com/google/material-design-icons.
Our sample application uses a Diagram and a NodeListView controls – both of them part of JsDiagram.
I. General Settings
We need to add two HTML Canvas elements to the web page where the sample application will be. One is for the NodeListView and the other is for the Diagram
<div style="width: 70px; height: 100%; overflow-y: auto; overflow-x: hidden; position: absolute; top: 5px; left: 0px; right: 0px; bottom: 0px;">
    <canvas id="nodeList" width="200"></canvas>
</div>
...........................
<div style="position: absolute; left: 70px; top: 5px; right: 0px; bottom: 0px; overflow: auto;">
    <canvas id="diagram" width="2100" height="2100">
        This page requires a browser that supports HTML 5 Canvas element.
    </canvas>
</div>
We place the two Canvas elements using CSS next to each other. The NodeListView is in a long and narrow Canvas and next to it is the Diagram Canvas, which has a big size of 211 pixels. It is important that we provide the two Canvases with id-s: we will refer to them later in the JavaScript code using these id-s.
Then we add references to the two JavaScript files that we use from the Diagram library – MindFusion.Diagramming and MindFusion.Common:
<script src="Scripts/MindFusion.Common.js" type="text/javascript"></script>
<script src="Scripts/MindFusion.Diagramming.js" type="text/javascript"></script>
<script src="OrgInfoDiagram.js" type="text/javascript"></script>
The last JavaScript file that we reference is OrgInfoDiagram and there we keep the code for our application.
II. The Diagram
We create the Diagram object by using the reference to the Canvas that will render it:
// create a Diagram component that wraps the "diagram" canvas
diagram = Diagram.create(document.getElementById("diagram"));
Then we use an instance of the Style class to create a style that will determine how newly created –DiagramNode -s are styled:
//styling
var shapeNodeStyle = new Style();
shapeNodeStyle.setBrush({ type: 'SolidBrush', color: '#e0e9e9' });
shapeNodeStyle.setStroke("Orange");
shapeNodeStyle.setFontName("Verdana");
shapeNodeStyle.setFontSize(9);
shapeNodeStyle.setNodeEffects([new GlassEffect()]);
The Style instance applies GlassEffect on the new nodes and places a thick orange border around them. We also allow users to edit diagram nodes by calling setAllowInplaceEdit .
diagram.setStyle(shapeNodeStyle);
diagram.setAllowInplaceEdit(true);
III. The NodeListView
The NodeListView control can hold both text and image nodes. We create it the same way we created the Diagram : by using the id of its Canvas element:
// create a NodeListView component that wraps the "nodeList" canvas
var nodeList = MindFusion.Diagramming.NodeListView.create(document.getElementById("nodeList"));
nodeList.setTargetView(document.getElementById("diagram"));
nodeList.setIconSize(new Size(36, 36));
nodeList.setDefaultNodeSize (new Size(18, 18));
It is important that we set the target of the NodeListView – this is the Canvas, where the newly created DiagramNode will be rendered. We also set the size of the icons in the NodeListView and the size that newly created nodes will have. For this we use the setIconSize and setDefaultNodeSize methods respectively.
We create the nodes for the NodeListView in a special method called initNodeList:
function initNodeList(nodeList, diagram)
{
    var node = new ShapeNode(diagram);
    node.setText("text");
    node.setShape("Ellipse");
    node.setPen("Gray");
    node.setBrush("White");
    node.setBounds(new Rect(0, 0, 48, 48));
    node.setEnableStyledText(true);
    node.setFont(new Font("sans-serif", 12, true));
    node.setStrokeThickness(2);
    nodeList.addNode(node);
    .......................................
The first ShapeNode that we create is a standard text node with the difference that we enable styled text for it: that means the user can enter bold, italic or underline text using the standard HTML tags <b>, <i>, <u>. We specify this with the method setEnableStyledText . We also add the node to the NodeListView that we have provided to the method.
In order to create nodes with SVG images, we need to create instances of the SvgNode class:
// add some nodes to the NodeListView
var svgImages = ["call", "reader", "computer", "data", "car", "text", "music", "movie", "nature", "calendar", "chart", "router",  "account", "alarm", "announcement", "book", "calls", "copyright", "event", "grade", "group_work", "info", "key", "list", "payment", "phone", "shop", "sign", "textsms", "theaters", "work"];
for (var i = 1; i <= svgImages.length; ++i)
{
    node = new MindFusion.Diagramming.SvgNode(new Rect(0, i * 48, 48, 48));
    node.setTransparent(true);

    var content = new SvgContent();
    content.parse(svgImages[i] + ".svg");
    node.setContent(content);

    nodeList.addNode(node);
}
We have copied the desired icons in the directory of the application and we have listed their names in a list. Then we cycle through all members of the list and create instances of the SvgNode class. We set their background to be transparent and we render the images thanks to the SvgContent class. Finally we also add the newly created SvgNode -s to the node list.
We call the initNodeList method providing the nodeList and diagram instances:
initNodeList(nodeList, diagram);
IV. Events
Though the code so far is enough to provide the desired functionality of our application, we want to customize the newly created diagram nodes and links. This can be achieved through events. We handle two of them onNodeCreated and LinkCreated.
diagram.addEventListener(Events.nodeCreated, onNodeCreated);
diagram.addEventListener(Events.linkCreated, onLinkCreated);
In the NodeCreated event handler we get the ShapeNode that is being created and make its shape to a round one with the setShape method. We assign to it a thick orange border and add some padding to the images – in case it is an SvgNode:
function onNodeCreated(sender, args)
{
    var node = args.getNode();
    node.setTransparent(false);
    node.setShape("Ellipse");
    node.setStroke("orange");
    node.setStrokeThickness(3);
    node.setFont(new Font("sans-serif", 4));
    node.setImagePadding(new Thickness(1.5, 1.5, 1.5, 1.5));
}
The linkCreated event handler applies some styling, but to newly created DiagramLink instances”
function onLinkCreated(sender, e)
{
    var link = e.getLink();
    link.setBaseShape(null);
    link.setHeadShape(null);
    link.setStrokeThickness(3.0);
}
We remove the default base and head shapes of the diagram links and leave the connectors to be just straight lines. We also draw them with a thick orange pen.
And these were the last lines of code that we had to add to make the application complete. You can download the source code, together with all all Diagramming libraries used from this link:
Download Organigram Application in JavaScript Source Code
You can use MindFusion Diagramming for JavaScript forum to post your questions, comments and recommendations about this sample or the Js Diagram library.
About Diagramming for JavaScript: This native JavaScript library provides developers with the ability to create and customize any type of diagram, decision tree, flowchart, class hierarchy, graph, genealogy tree and more. The control offers rich event set, numerous customization options, animations, graph operations, styling and themes. You have more than 100 predefined nodes, table nodes and more than 15 automatic layout algorithms. Learn more about Diagramming for JavaScript at https://mindfusion.eu/javascript-diagram.html.
