Anchor Points
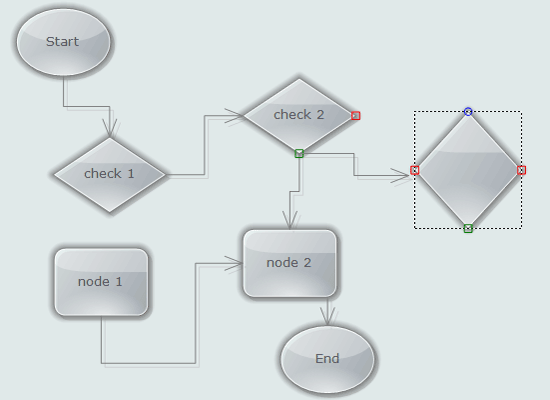
All diagram shapes can have anchor patterns - predefined points at the edge where links snap to. There is a set of predefined patterns and you can create your own custom patterns.
Anneal Layout
A demonstration of the Anneal layout based on the simulated annealing. This is a a general-purpose optimization method used to solve large-scale combinatorial problems by simulating the process of heating and cooling of metal to achieve freedom from defects.
Class Diagram
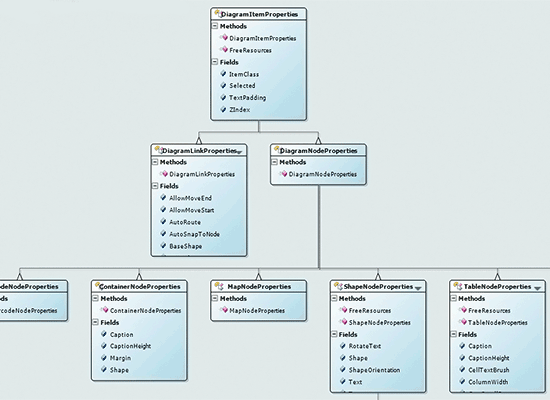
A sample application that parses the type info in an assembly and uses the diagram library to create table nodes each one with data for the members in any class, enum, interface or structure. The tree layout is applied to arrange the nodes.
Clipboard Operations
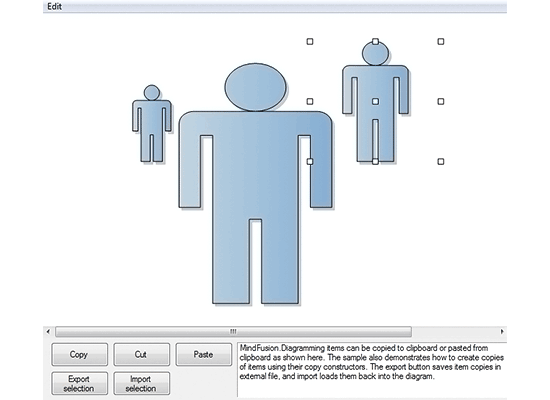
The control supports the full range of clipboard operations: copy, cut, paste as well import and export of arbitrary number of diagram objects.
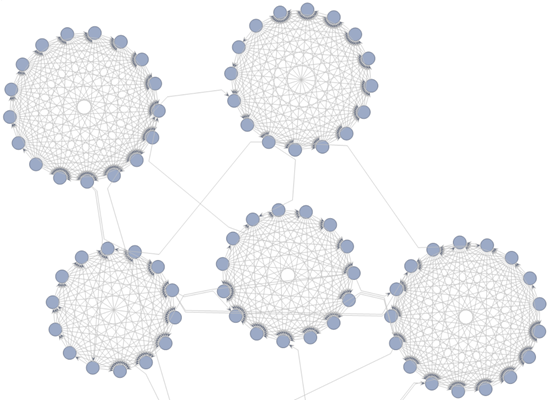
Cluster Layout
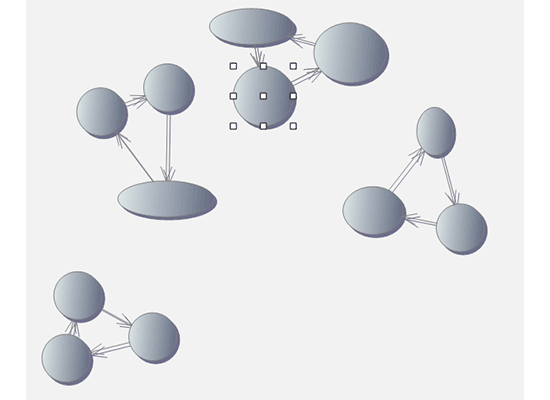
This project demonstrates the CompositeLayout, CircularLayout and AnnealLayout graph layout classes. CompositeLayout partitions the diagram into several subgraphs and applies a user-specified layout algorithm to each part.
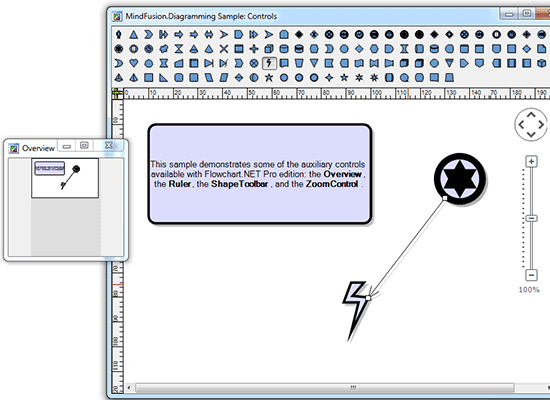
Controls
A demonstration of some of the auxiliary controls that ship with the diagram: overview, shape toolbar, zoom control and a ruler control.
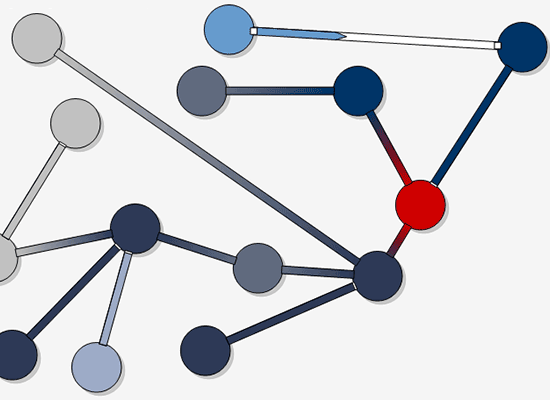
Custom Draw
Each object in the diagram supports custom drawing. Here the appropriate draw event is handles and diagram links are custom painted in three possible ways - flat, gradient or arrow.
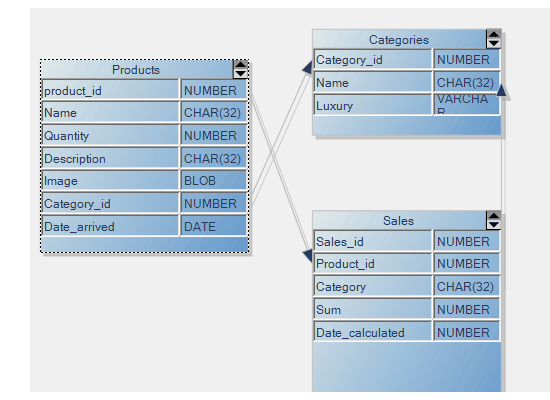
Database Schema
The diagram library is perfect for creating any database schema as this sample demonstrates. Draw tables or use the TableRelationships behaviour to connect rows between tables, import a DB schema or save one.
Decision Layout
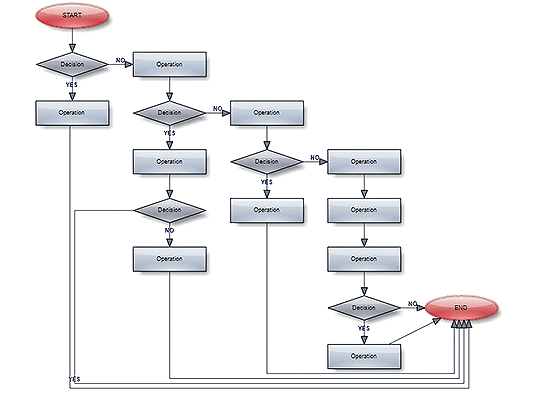
A demonstration of the decision layout on a random graph. The layout arranged decision boxes with up to 3 outgoing links in rows and columns and exposes properties for specifying the padding between tows, columns and links.
Demo
The demo program for the diagram library shows a selection of the most important features of the control organized in subsections which together list more than 50 interactive samples.

Directory Tree
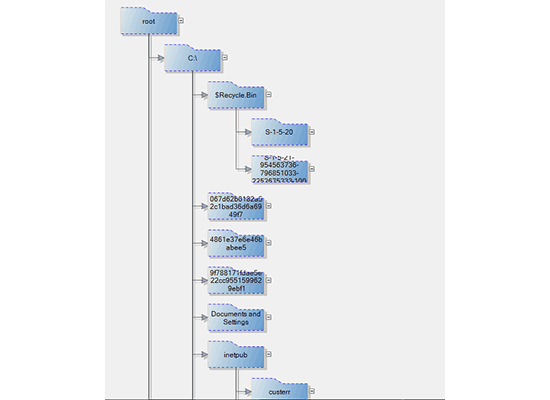
The sample enumerates the directory structure of your computer and creates a node for each folder. It then customizes the TreeLayout to arrange the nodes in a hierarchical structure.
Effects
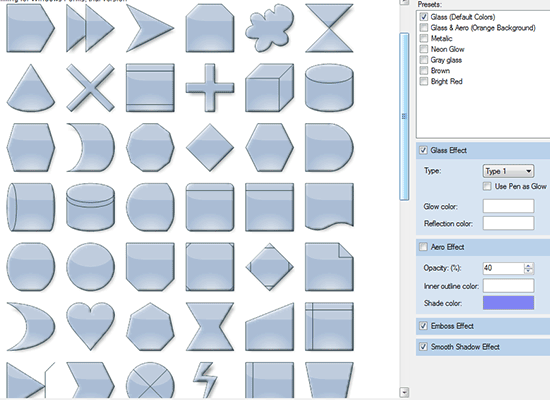
A demonstrates of the available node effects with possible customization options: glass, aero, emboss and smooth shadow effects in different colors and backgrounds.
Entities
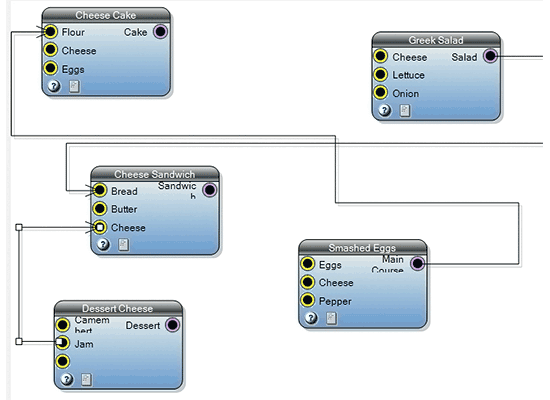
Customized table nodes are used here to provide entity objects where users can add description and input/output data. The nodes have anchor points for individual nodes and you can connect them.
Event Logger
Learn which events are fired when the user interacts with the diagram - when nodes are created, deleted, connected, moved, resized etc.

Export and Import
The library supports export to multiple formats including PDF, SVG, Bitmap images, DXF and Visio. The sample demonstrates how this is done including how to export custom-drawn elements.

Fishbone
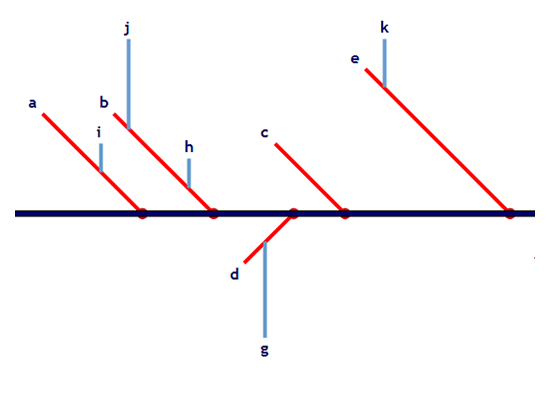
This fishbone diagram is made from derived node classes, which implement custom drawing by overriding the Draw and DrawShadow methods. The sample also includes handling of custom user interaction and hit testing.
Floor Plan
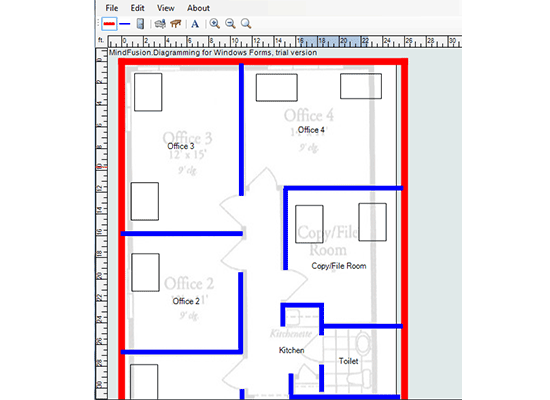
An imitation of a living space designer. The sample shows how to create derived diagram and node classes for storing addition data and implementing custom interaction logic and how to set new measure units for the Ruler control.
Flowcharter
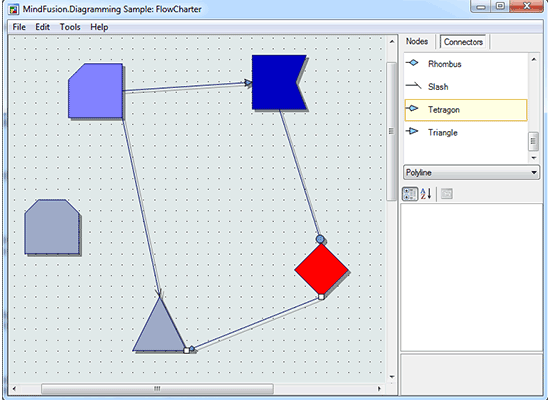
A ready-to-use application for drawing flowcharts. It includes a list with various diagram shapes to choose from, a color selection menu, save and load buttons, print and clipboard operations.
Form Editor
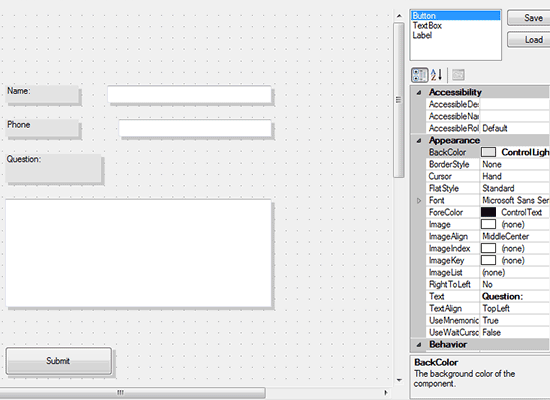
A demonstration of the ControlNode objects, which can host any .NET control. In this case a sample form is created by the available text box, label and button shape nodes.
Fractal Layout
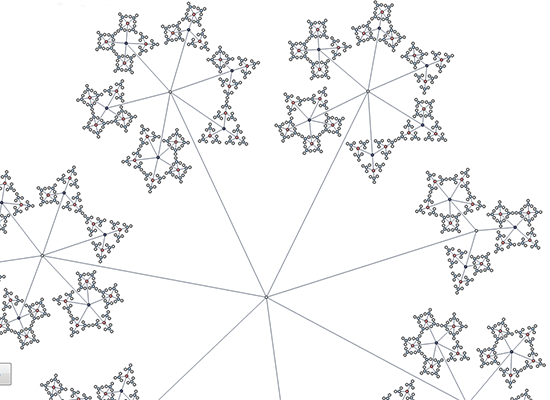
A demonstration of the fractal layout on a random graph. The fractal layout is a tree-like algorithm that places child nodes symmetrically around their parent node.
Genealogy
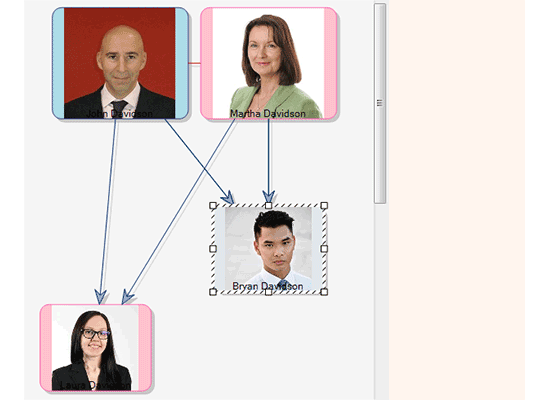
This sample uses a genealogy tree example to teach you how to save and load diagrams from a database programmatically. Each person and relationship you create is persisted in a DB file.
Icon Nodes
Learn how to create a custom node class derived from DiagramNode that exposes some new properties and implements its own drawing logic.
Interactive Table
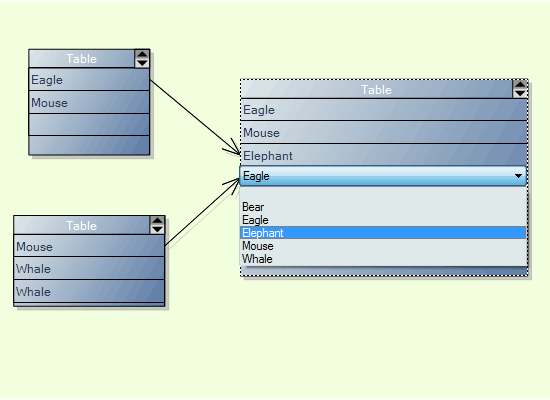
This sample draws a combo box whenever a table cell is clicked. It handles the inPlaceEdit event for the diagram to render the combo box and displays the chosen item as text in the cell.
JavaScript Parser
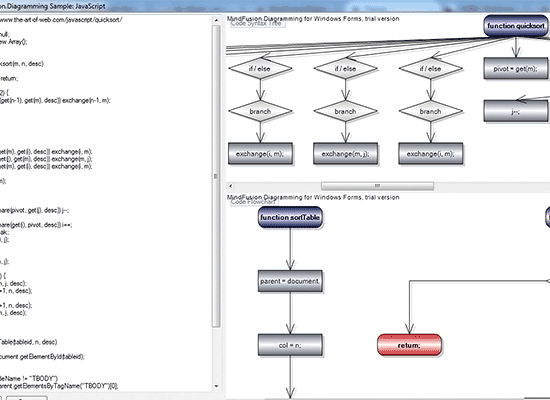
The FlowChart layout is ideal for arranging code syntax diagrams. Here arbitrary JavaScript code is parsed to create a flowchart graph which is ordered with the FlowChart automatic layout.
Lanes
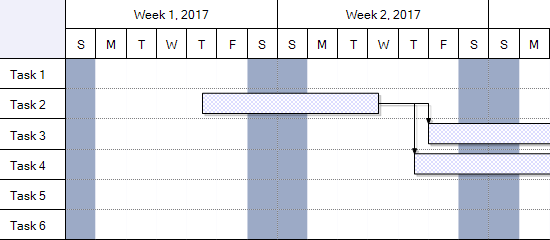
The lanes property of the flowchart library is used here to create a sample Gantt chart. Nodes can be placed only in lanes.
Layered Layout
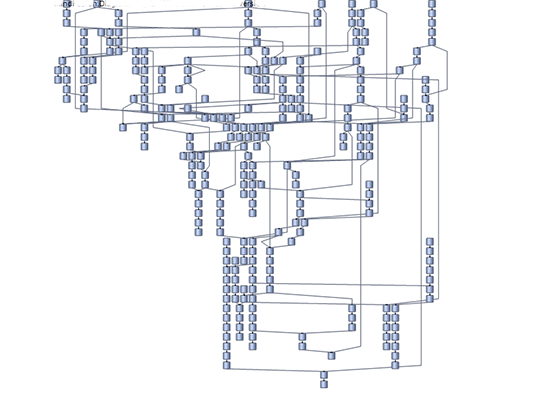
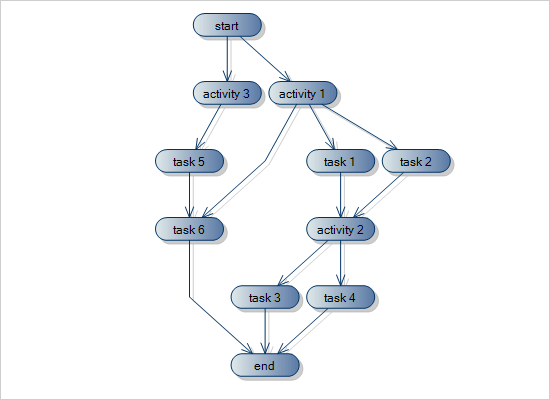
The Layered layout assigns diagram nodes to distinct horizontal or vertical layers. While arranging the layers, the algorithms seeks to arrange connected nodes close to one another, aims to arrange links to flow in one direction and cross as few layers as possible and not cross other links.
Link Routing
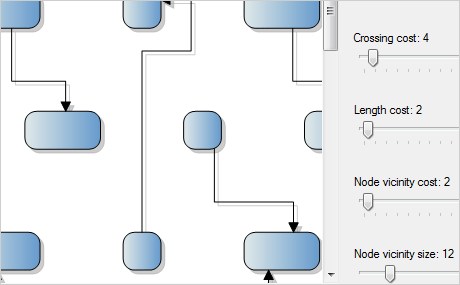
The routing algorithm for diagram nodes exposes many parameters, which you can adjust. Move the sliders to change routing cost properties and check how they affect arrow routes. Each cost property is a penalty value added by the route evaluation algorithm to the cost of a route when a given condition is met.
Logic Gates
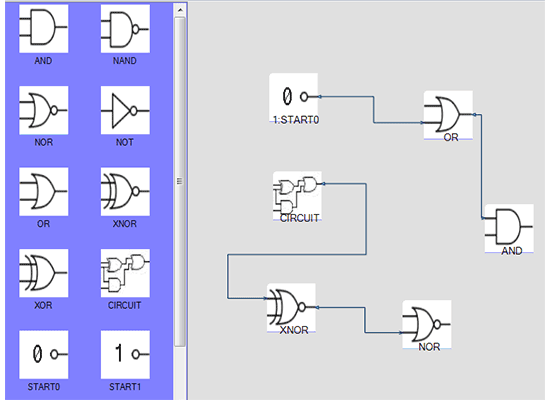
A selection of logic gate images are used to populate a list from which users can drag and drop icons. Each icon turns into a diagram node, which contains the image. Use the nodes to build a digital circuit.
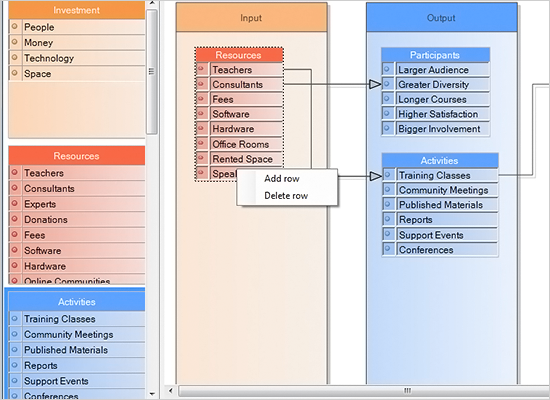
Logic Model
The NodeListView control is used to hold instances of TableNode-s that represent resources, activities, outputs and outcomes. Select nodes from the left and drop them onto the three containers to the right to create a logic model
Magnifier
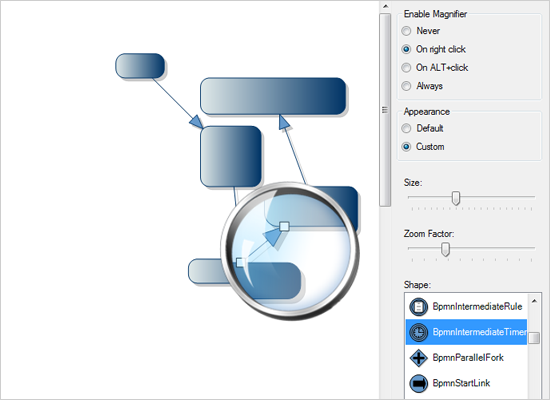
The magnifier tool is one of the auxiliary tools that come with the library. It has multiple customization options as this example demonstrates - shape, size, magnification factor and trigger events.
Molecule Viewer 3D
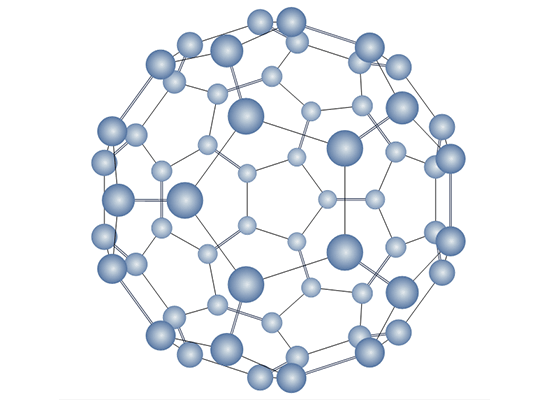
A structural formula for a chemical compound is rendered with the DiagramView3D component. You can drag the mouse to move the camera across the plane and use the mouse wheel to move the camera back and forth. Drag + Ctrl rotates the camera.
Multiple Views
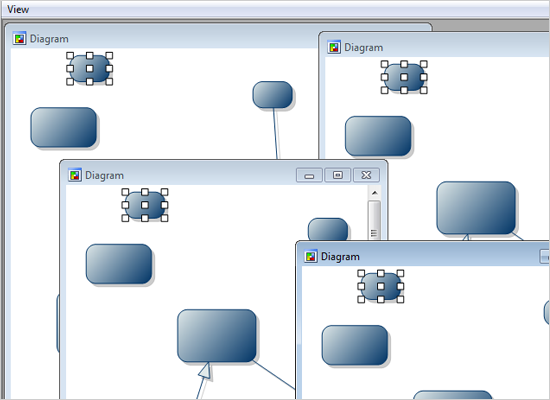
The sample shows you how to attach several views to the same Diagram object and how updating the diagram through one of the views causes all others to refresh themselves and reflect the change.
Predefined Shapes
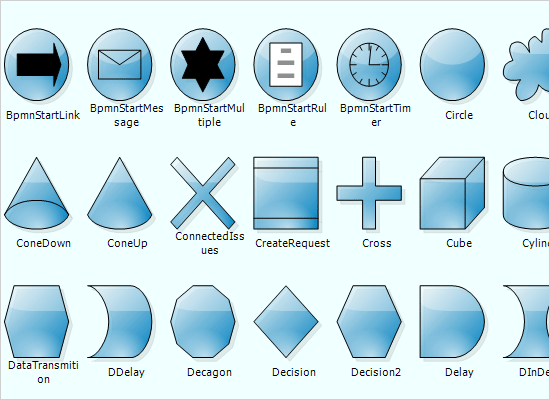
A list with all predefined node shapes that ship with the control. You can look a shape from this list, note its string identifier and then create it in code.
Process Layout
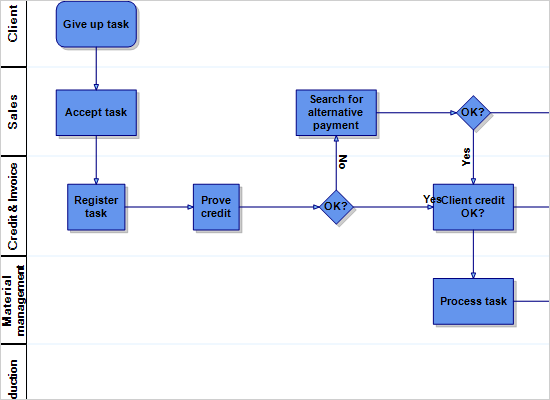
The powerful SwimlaneLayout is used here to arrange a random flowchart with nodes that demonstrate a process. The layout separates the nodes in lanes, which makes the process clear to understand and easy to follow by the user.
Reflections
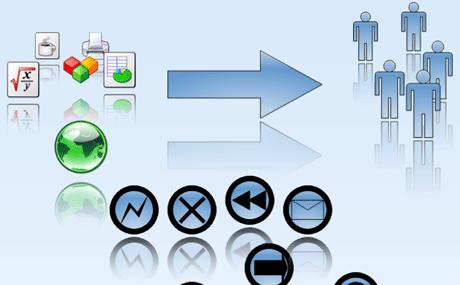
A special kind of node has been defined in code, which renders the reflection of its content. The sample lets you create nodes with drag and drop from the NodeListView to the right. You can also customize image nodes by clicking on them.
Scripting
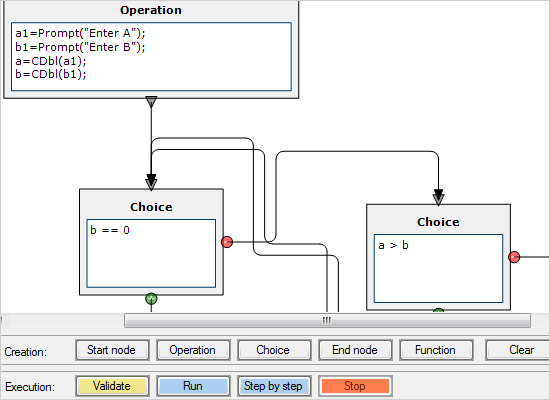
Use the MindFusion.Scripting dll to implement a dynamic process calculation. The sample lets you create nodes of different types that illustrate the logic flow of a function. Several predefined examples are included.
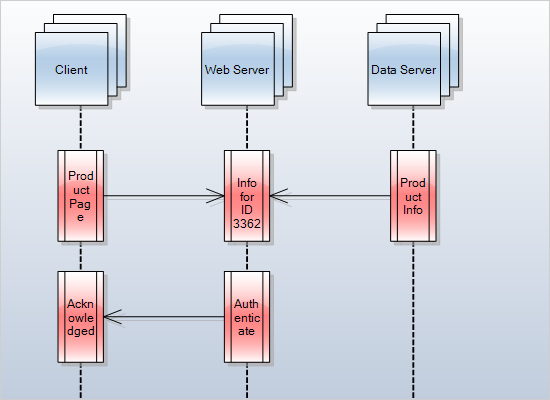
Sequence Diagram
The NodeListView control to the right in this sample contains only two types of nodes - an object and a message. You can use them to create new items in this sequence diagram as well customize the existing items to build a useful chart that shows how the objects operate with each other and the order of action.
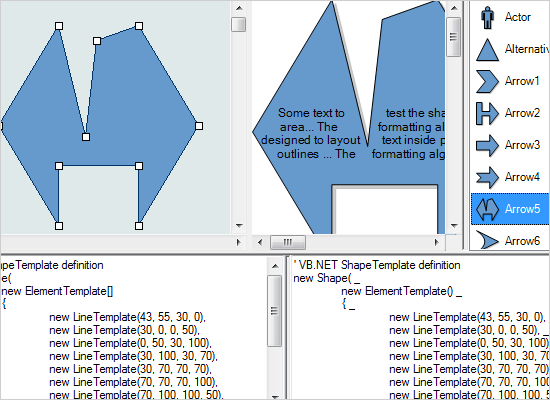
Shape Designer
The shape designer application provides you with a GUI to customize your own diagram nodes based on any of the predefined diagram nodes that ship with the diagram. The code for the new shape is generated in both C# and VB.NET, the application also supports a set of appearance customization options, import, export and other options.
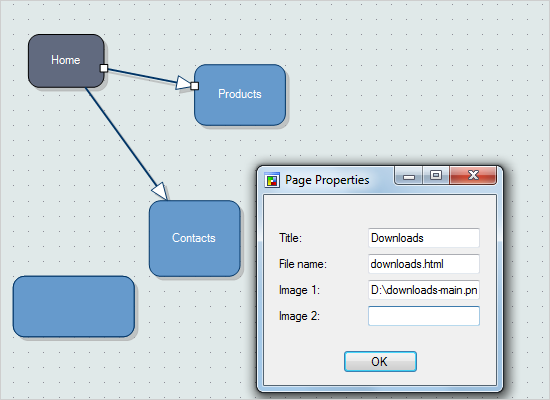
Site Map
This sample generates the HTML for all pages in a website whose diagram you draw. You just need to draw the connector from the root page to the next page in the hierarchy. A dialog with the properties for the new page appears and its node is created automatically.
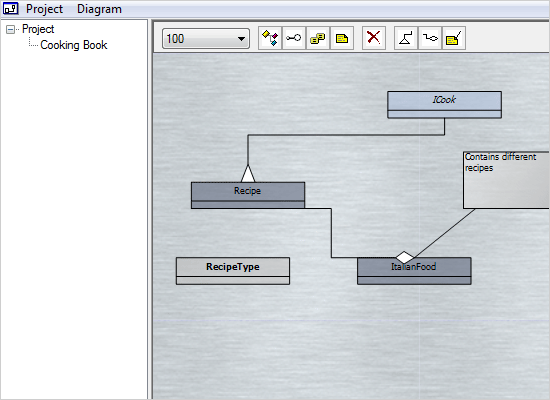
Software Designer
That's an application that lets you drag and drop diagram nodes that represent different elements in a software application: class, enum, interface. You can choose among two connector types, which show inheritance or containment and add annotations.
Spring Layout 3D
This is an animated 3D version of the SpringLayout algorithm. The nodes are displayed with the DiagramView3D control. You can use the mouse to perform various actions on the camera: pan, rotation as well back and forth movement.
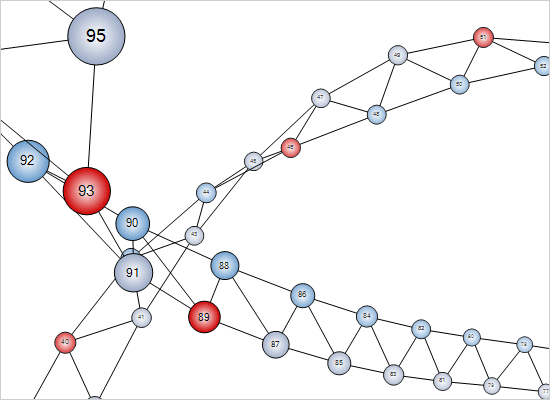
Stress Test
This sample provides you with the fastest way to create nodes and lets you examine the speed time with which any number of nodes and links between them are generated. You can also test how the arrow routing feature affects the speed.
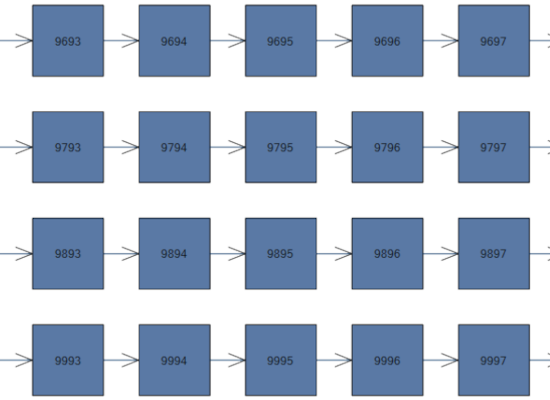
Tabbed View
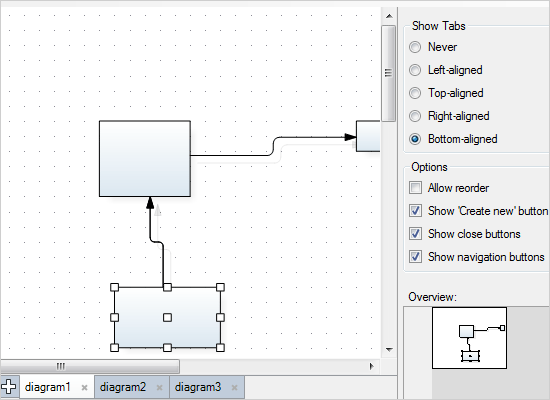
The TabbedDiagramView control is a full-featured tabbed control that lets you add unlimited number of tabs each one with a DiagramView. The control supports plenty of customization options: you can change how and where the tab navigation buttons appear and which of them and choose which of them are rendered.
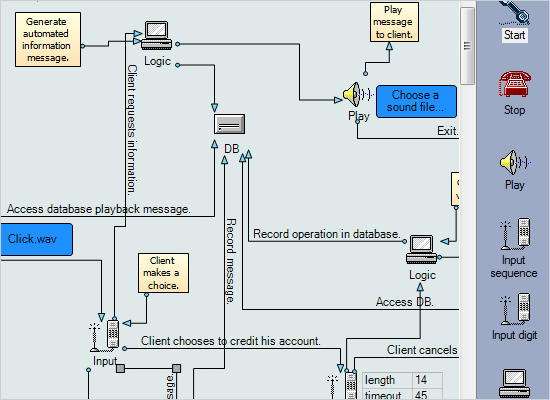
Telephony
You can use the diagram control to build IVR-like flowcharts. The sample also demonstrates automatic link routing and node grouping, which creates compound diagram nodes. The NodeListView control is used to host a few custom nodes used by the application.
Ternary Connections
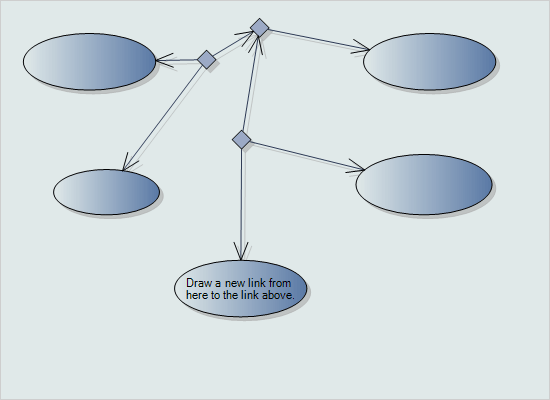
Here the feature of DiagramLink-s to be unconnected to any node is used to create ternary connections. You can draw a link from a node to another link. Then the the connector is split in two parts which stay temporarily unconnected. The LinkCreated event is handled where a medium box node is created.
Tree Layout
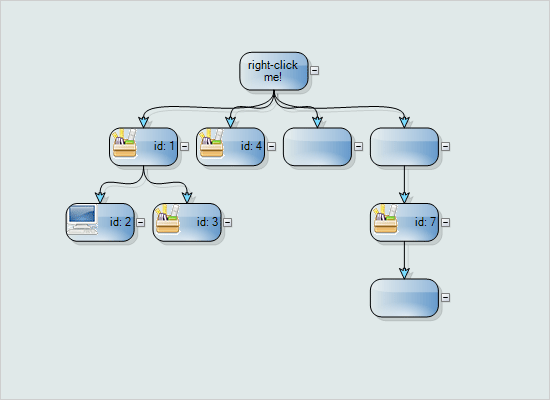
The TreeLayout algorithm is the perfect way to arrange a hierarchy. Drag and drop nodes from the bottom and see how they get arranged automatically. Create child nodes by clicking on a node, expand and collapse hierarchies or move a parent node to see how its children move along.
Treemap
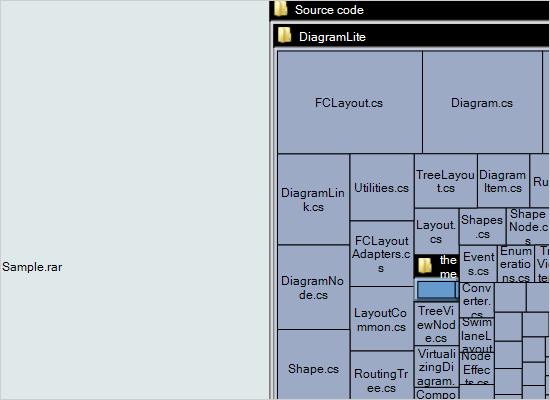
The treemap algorithm is a special algorithm that represents the objects as polygons with different size and colors. The size and color of each polygon provide information about the item in the hierarchy based on the sorting criteria that was chosen.
Tutorial 1
Learn the first steps to create a diagram from an XML file and arrange it using the LayeredLayout algorithm. The sample also demonstrates some basic appearance settings for nodes and links.
Tutorial 2
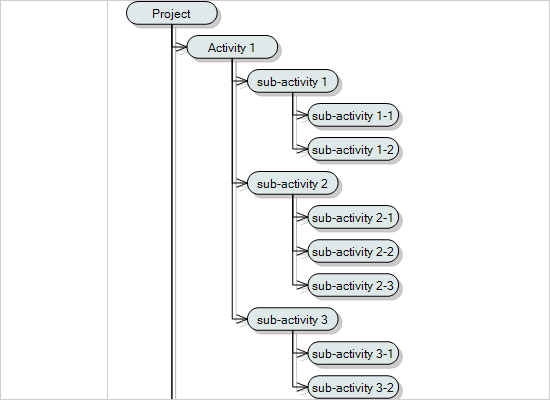
This tutorial teaches you how to create a hierarchy of nodes reading an XML file. Child nodes are created recursively using a method. When all nodes and links are created, the TreeLayout is applied to arrange the nodes.
Visio Stencils
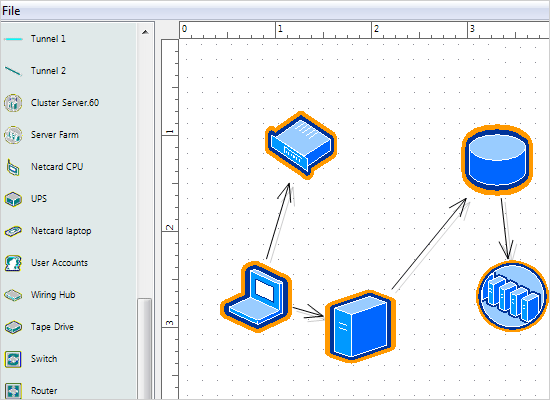
The sample demonstrates the control's ability to import and export Visio drawings. Here you can import any file with stencils created in Microsoft Visio and see how they load in the NodeShapeList control.
 Run
Run
 Download
