
The MindFusion.Diagramming API adds flowchart and diagram editor to your application, letting you visualize hierarchies, layouts and flows. It is used to present organizational charts, project plans and work flows in business software; logic gate and circuit diagrams in engineering tools; floor plans and factory layouts in industrial applications; dialog editors and state machines in IVR systems and game engine tools.
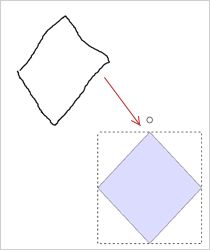
A FreeFormNode collects all points from users' mouse or touch input and displays them as node's outline.
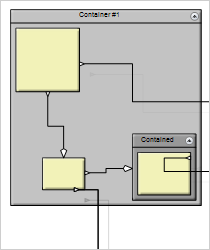
Containers hold other Node-s and can be nested one within another, the containment hierarchy depth is unlimited
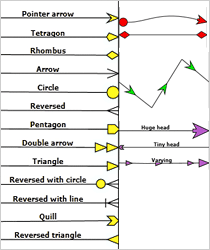
Links can have various arrowhead shapes and you can associate such shapes with links origins and segment centers.
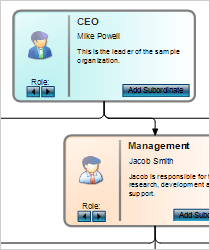
CompositeNode-s are graphical widgets similar to controls, which can be arranged in hierarchies.
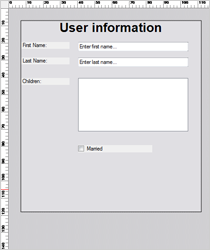
The ControlNode class allows using any .NET Windows.Forms control as a node in the diagram
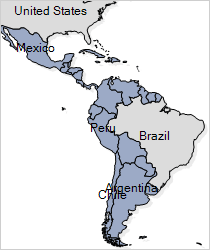
The MapNode class represents nodes that can render geographical maps. Map items can be selected.

The Online Shape Designer tools lets you create and customize your own shapes from primitives.
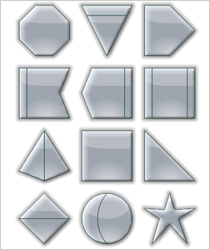
Nodes can have visual effects - Aero, Glass, Neon Glow, Metalic etc. Effect colors can be customized, when applicable.
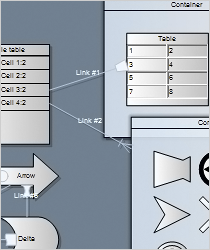
Save your preferred diagram outlook into an XML Theme or apply and customize one of the 40 predefined themes.
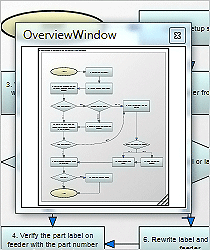
The Overview control provides a scaled-down view of a Diagram and allows scrolling and zooming with the mouse.
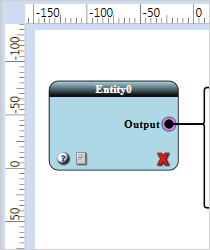
The Ruler control provides horizontal and vertical scales that helps users measure and align diagram items.
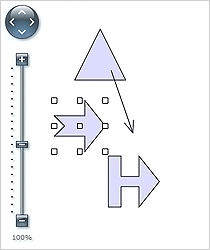
The Zoom control lets user change interactively the current zoom level and scroll position of the diagram.
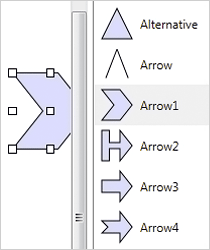
The ShapeListBox lets users drag-and-drop a Shape to the diagram's canvas to create a new ShapeNode.
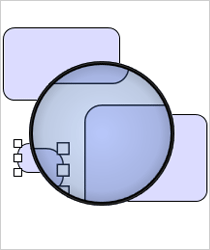
The Magnifier has customizable appearance and zoom factor and is triggered by a mouse action or key stroke.
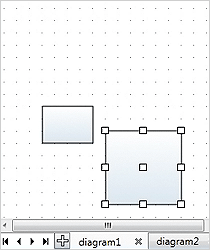
The diagram pages can be activated through the tabs in the tray located at one of the four sides.
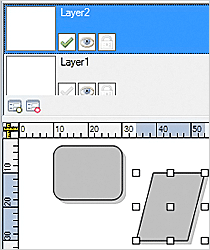
The LayerListView is a list box with Layer-s that hold diagram items. Layers can be hidden, active and unlimited in number.
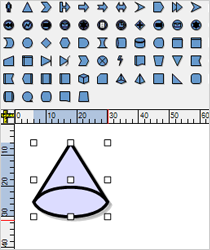
The ShapeToolBar control displays image buttons representing selected shapes defined via the Shape class.

The NodeListView renders a list with DiagramNode-derived objects, which can be dragged and dropped.

The SwimlaneLayout class places diagram nodes that represent activities on swim-lanes that represent resources.
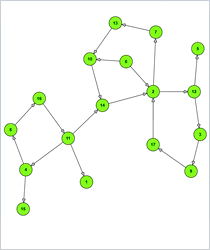
The AnnealLayout assigns costs to graph configurations and finding the minimum cost configuration.
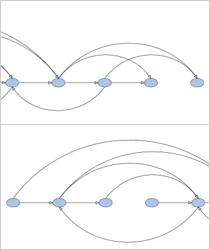
The TopologicalLayout places nodes linearly and each node comes before all destination nodes of its outgoing links.
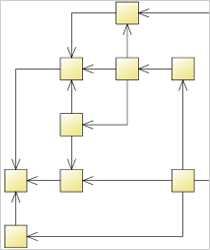
The OrthogonalLayout draws each link as a chain of alternating horizontal and vertical segments.
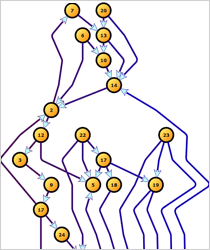
The LayeredLayout arranges diagram nodes in distinct horizontal or vertical layers based on several criteria.
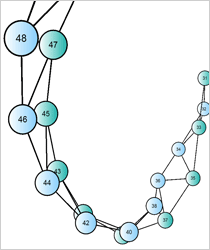
An animated 3D version of the SpringLayout algorithm. You can rotate and pan the camera.
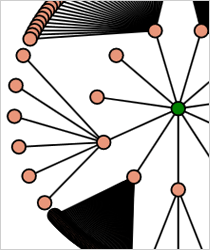
The radial tree layout is a method of displaying a tree structure in a way that expands outwards, radially.

The TreeLayout combines several algorithms that arrange diagram nodes in tree-like hierarchies.
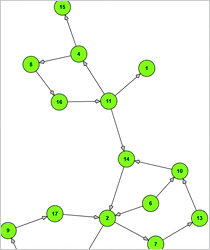
The SpringLayout simulates a physical system in which nodes repulse each other and links act as confining springs.
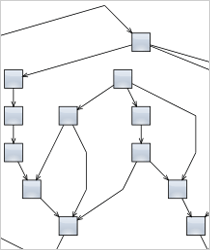
The OneWayLayout ensures that links enter nodes from the same direction and exit them from the opposite side.
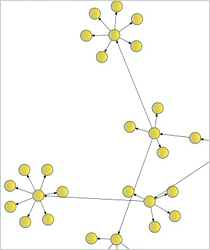
The EnableClusters property of SpringLayout makes diagrams laid out in distinct clusters as shown below.
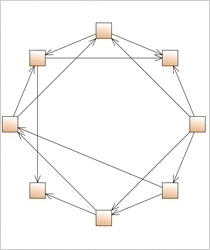
CircularLayout distributes nodes evenly on the circumference of a circle at positions that have as few link crossing as possible.
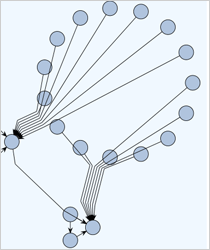
CompositeLayout is a multi-level graph layout that combines several layout algorithms from the diagram library.
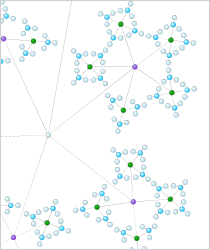
The FractalLayout is a tree layout that places child nodes symmetrically around their parent node.
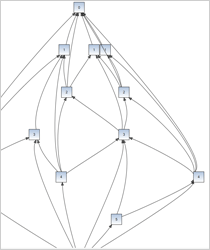
The HierarchicalLayout places nodes on user-defined levels and all links have a single segment and do not intersect.

The GridLayout arranges diagram nodes in a grid, keeping connected nodes close together.
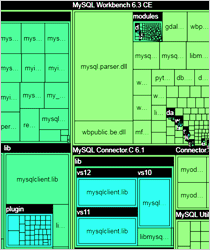
The TreeMapLayout class arranges hierarchical (tree-structured) data as a set of nested rectangles. Colors group items.
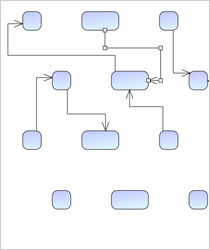
The WinForms diagram control includes various arrow routing options that rely on penalty values to calculate the cost of a route.
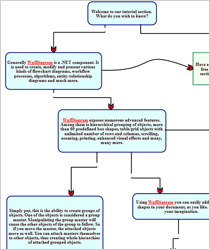
This diagram defines a dialogue that can be conducted by automated system.
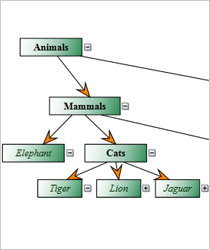
This diagram supports hierarchical grouping and collapsing/expanding subtrees.
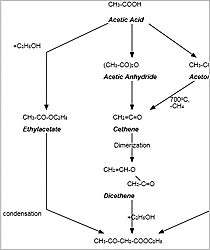
This diagram combines various text styling attributes.
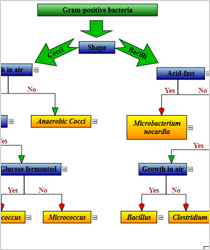
The chart uses different arrowhead types and sizes as well expandable nodes.
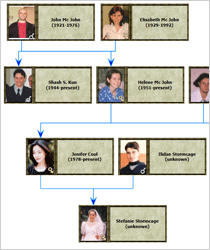
Nodes hold images and custom painting is used to achieve the various visual effects.
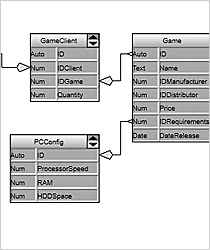
Table nodes and perpendicular links are used to build this DB design chart.
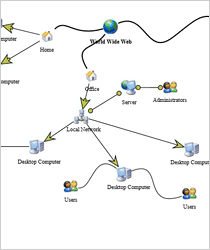
A diagram with Bezier links, image nodes and transparent nodes that hold text.
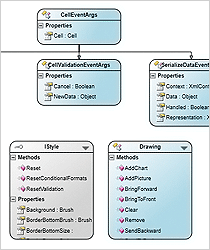
Each class is presented with its methods, properties and fields. Different API members are painted in different colors.
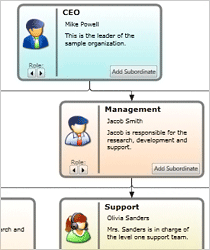
Diagram nodes are styled through custom templates and support multiple images and text formats.
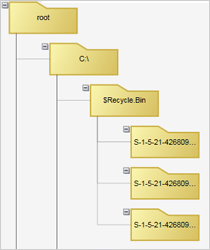
Use the diagram control to build a tree of all folders in a given directory and arrange them with the TreeLayout.

This diagram is built by derived node classes that implement custom drawing and custom interaction handling.
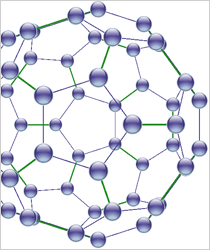
Use the DiagramView3D component to display a 3D model of the structural formula of a chemical compound.
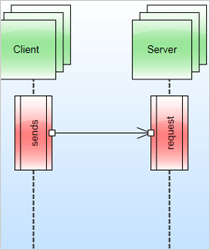
This is an interactive flowchart that shows how objects operate with each another and in what order.
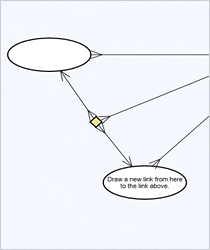
When you draw a link an intermediate node is created under the mouse and three helper links.
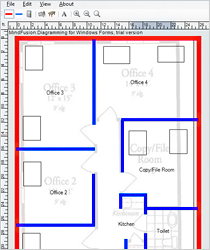
Use custom classes that inherit Diagram and DiagramNode to store additional data and implement custom interaction logic.
"We are using the WinForms diagramming component and are very happy with its quality. Moreover, we thank the MindFusion team for the individual and highly motivated customer support. Even in difficult situations and under time pressure you could help us out anytime."
Mr. Joerg Hubacher, CEO of AMADEE