Java Trace Tool
A faster and better way to monitor application flow and detect hard-to-find bugs in Java code.
Make Your Life as a Java Developer Easier
Your reliable tool for hunting elusive defects in Java applications. Speed up debugging, improve performance.
A better way to trace bugs
HyperDebug comes in handy when you need to fix problems in Java software that:
- - can't be reproduced manually,
- - you have no access to the machine where the problems occur,
- - you cannot use a debugger or it didn't solve the problem,
- - there is no or insufficient log information.
HyperDebug works with applications running in JVM (Java Virtual Machine).
Video: Optimizing a Java Application with MindFusion Java Profiler HyperDebug
Log application execution flow
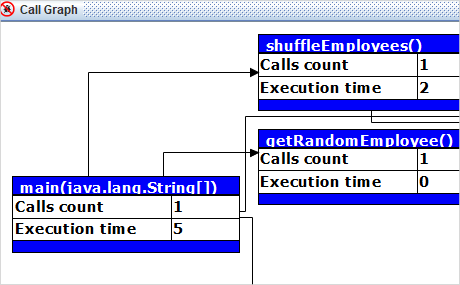
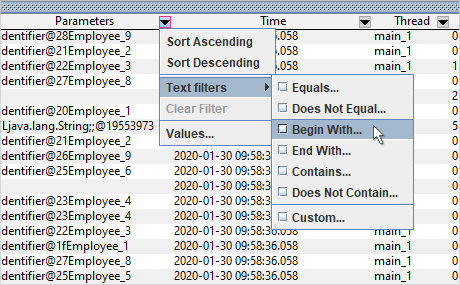
With HyperDebug you can track completely every method call of your application. The tool logs the time a method execution took to complete (entry and exit time) and the parameter values. You can choose which classes to measure. No need to modify your Java code, the trace tool generates the log flies through JVM agent. The logs are generated in CSV format.
Video: Detecting a Memory Leak with HyperDebug Java Trace Tool
Collect helpful debug information
Besides detailed application information in log files, with HyperDebug you can can also collect:
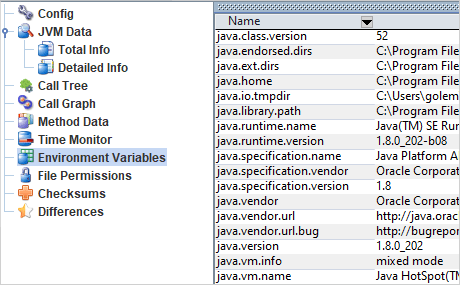
- - Values of the environment variables. Because sometimes the OS encoding and time zone affect the application work.
- - File access permissions for the application directories. Because sometimes mis-configured permissions cause errors.
- - Necessary configuration files. Because bad configuration settings may cause problems.
Generate dumps for exceptions
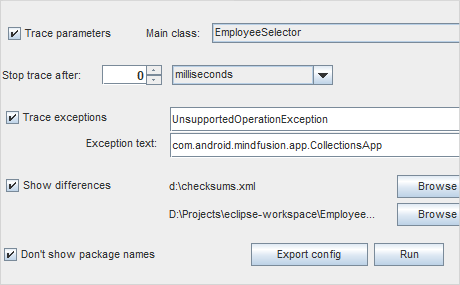
With HyperDebug you don't have to wait to manually generate dumps. HyperDebug can generate thread dump and heap dump, when exception of specified class (or with specified message) occurs. You don't have to attach JVM profiler and wait for the right moment to generate manually the dumps.
Check application integrity
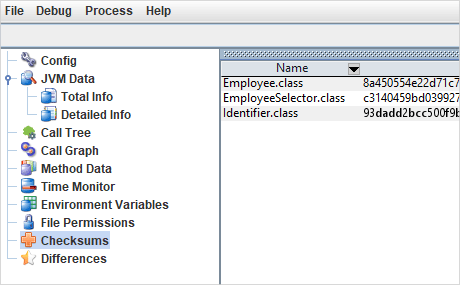
MindFusion Java trace tool can calculate checksums of the application files. This allows you to compare the expected checksums with the actual, and detect file corruption. The modified files (only) could be collected and sent for analysis.
Process huge log data
HyperDebug provides a set of smart tools that greatly decreases the data noise. They can process huge log data to extract the interesting log file fragments (by time or regex). They can transform the log file format (via regex) and you are able to see logs, merged from different systems with different formats could be merged. You can order different third party log analysers to be run over the unified log data.
Privacy is respected
The debug information gathered by the trace tool is not sent anywhere automatically. The collected files could be inspected (and sensitive data removed) before sending to the Java developer who will analyse them.


