
A list of downloadable samples that demonstrate various features of the Diagramming for ASP.NET component.
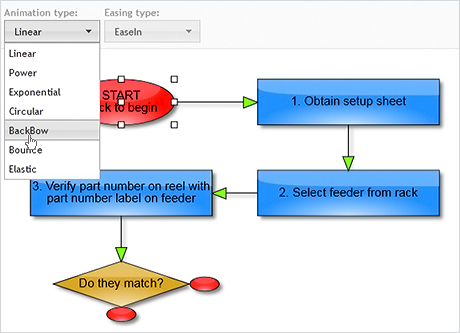
See how MindFusion.Diagramming for ASP.NET renders an interactive decision-making flowchart. The diagram nodes and links are animated. You can choose among 7 animation types and 4 easing types, which are easily exchanged through combo boxes at the top of the sample.
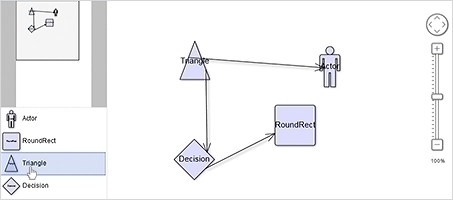
Diagramming for ASP.NET comes with a set of auxiliary controls that enhance the capabilities of your online application with advanced features like zooming, panning, creating nodes with drag & drop, diagram overview. This sample makes use of the respective auxiliary controls - the NodeListView, Zoom and Overview. You can drag diagram nodes from a list-box, scale and pan the flowchart and follow all interactions in scaled-down view with the Overview control in the top-left corner of the web page.
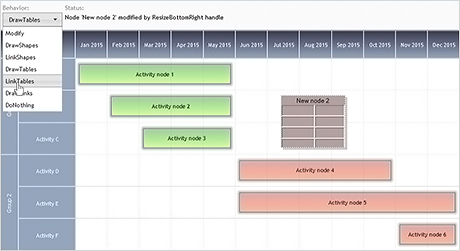
MindFusion WebForms diagram control supports an impressive set of behavior options, which are demonstrated in this sample. Here you see a diagram in ImageMap node, which responds to user interactions differently according to the currently set Behavior. You can choose among 7 types of Behavior, which are listed in the combo box at the top of the web page.
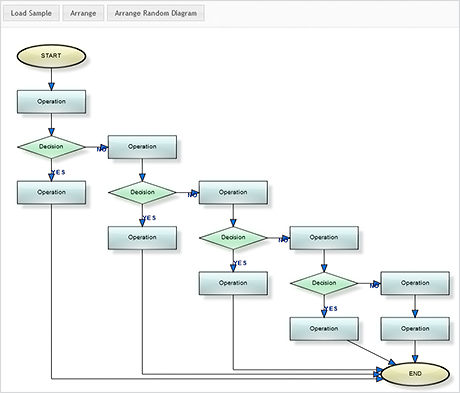
Automatic Decision Layout Algorithm
A sample that uses the Decision layout algorithm to arrange a diagram in the browser. You can load a sample diagram or generate and load a random flowchart. The decision layout algorithm is particularly handy when applied to a process chart, which illustrates a succession of logical steps. The algorithm is designed to visually order the nodes in a way that makes the steps of the decision tree easy to follow and understand.
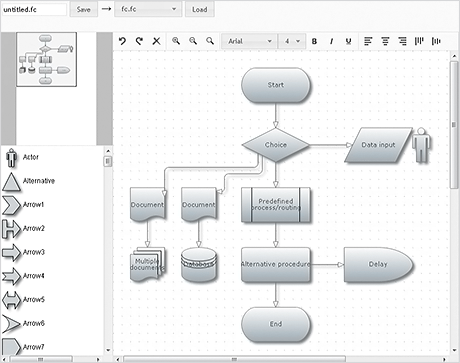
Experience first-hand how smooth and easy it is to create a flowchart online using MindFusion Diagramming for WebForms. The sample starts with a diagram created in code. You can quickly extend the diagram with new nodes by just dragging them from the list-box at the left side. Once the nodes are created, it's time to edit their contents. The component provides intuitive in-place editing features and a host of style and formatting options that will delight your customers. When the flowchart is ready, save it with the press of a button to load later.
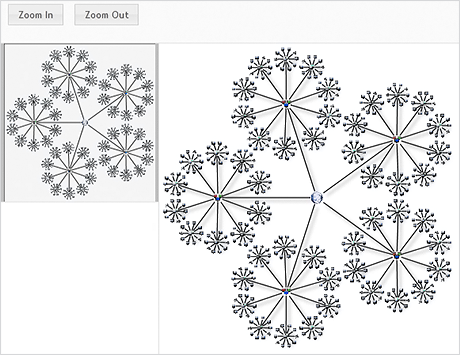
The fractal layout algorithm is just one of the 11 automatic layout algorithms provided with the control. Use them to dramatically change the layout of your flowchart with a single method call. MindFusion knows that software comes in many shapes and with various requirements - and we make sure a crafty layout to meet the unique needs of your web application is straight at your finger tips.
![]()
Icon Nodes - A Custom DiagramNode Class
MindFusion ASP.NET diagram control comes with an impressive list of predefined node shapes for all tastes and needs. Nonetheless you might come to a point where the requirements of your application arise the need of a special type of node. This sample works on this scenario and provides an easy and elegant solution - a custom node class that extends the rich capabilities of the DiagramNode object even further and implements its own drawing logic.
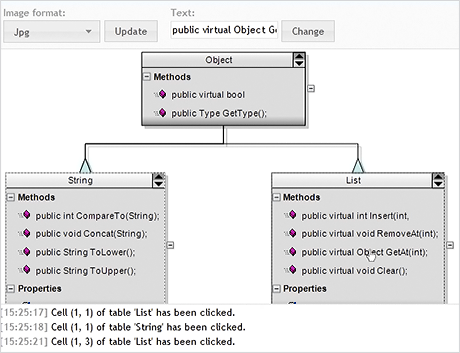
Diagramming for WebForms is a surprisingly versatile web control, which can operate in full three independent modes. This sample demonstrates the HTML Image Map mode. You can judge how elegant and light-weighted the control is by the speed it responds to server side events like object selection and text editing. You can change the format of the generated image with a combo box at the top of the sample.
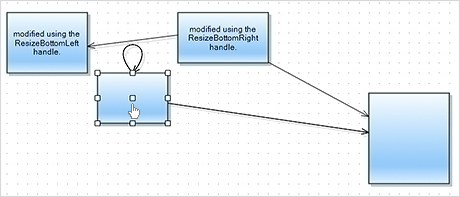
Diagramming for ASP.NET implements a full interaction model that gives your web application a competitive edge with amazingly responsive diagrams and charts. Run this sample to experience the impressive speed and ease, with which the library responds to user actions. No matter if you create, delete, move or connect nodes - any single operation is performed smoothly, on the second without any delay. It is hard to believe you are working in a browser.

MindFusion Diagramming for WebForms is one of the most flexible programming tools on the market. Besides it's traditional use as a flow diagramming component, you can find it all sorts of avant-garde implementations like the Gantt chart demonstrated by this sample. Here you can use the mouse to create items, which are automatically aligned to the lane grid at the background. Each item is drawn on a single row spanning multiple grid cells imitating the behavior of a typical Gantt diagram.
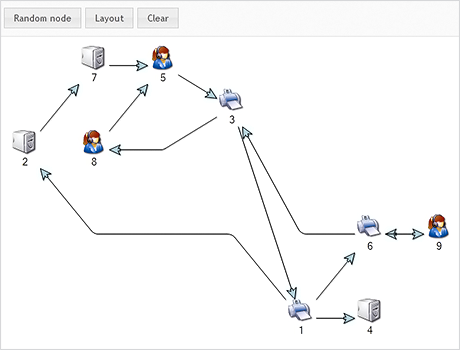
The layered layout is one of the 11 automatic layout algorithms provided with the control. This structural layout algorithms turns even a small, random diagram into a beautiful, easy-to-comprehend chart. The layout follows strict criteria, most important of which are: connected nodes must be placed close together; links must flow in one direction if possible; links must cross as few layers as possible; links must not cross other links. Run the sample to experience the amazing transformation of an ordinary diagram with the simple press of a button.
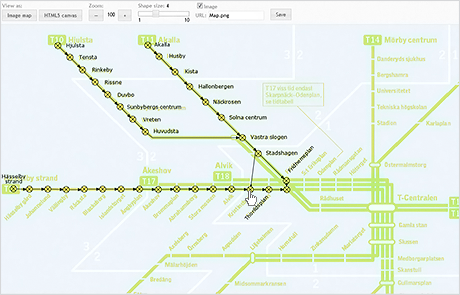
One more impressive way to utilize the amazing capabilities of the Diagramming control. Here you see an urban transportation map editor. The map is represented by a static image, the stations are created when you click on a map. You can link stations by clicking on the origin node and dragging to the destination node. The names of the stations are editable - just double-click on the station symbol. The map can be easily scrolled and zoomed in and out for greater precision. You can even save changes to the server with the button at the top of the page.
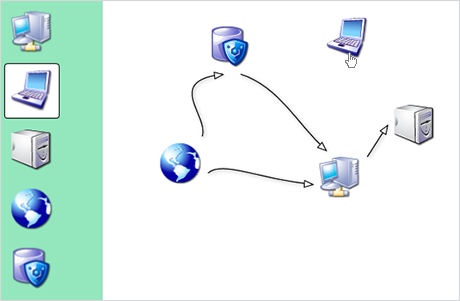
Learning a new API might not be easy but MindFusion skillful developers and caring support team have made everything possible to facilitate the programmers who use Diagramming for WebForms. In this sample you will learn how to handle client-side events in the Canvas mode. You can select nodes from the list-view to the left, drag and drop them onto the drawing area. When you draw near the borders of a node, a link is created. The sample is an example of how light-weighted the library is - note the instant response of the control by even the tiniest mouse movements and interactions. Everything is drawn on the spot without the smallest trace of delay.
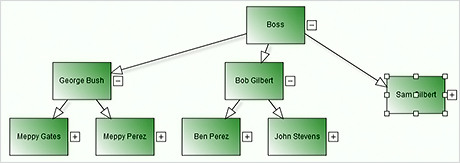
If the requirements of your web application demand AJAX, this sample is right for you. Here you can learn to make calls from client side events. MindFusion Diagramming for ASP.NET supports full interactivity when working in the HTML Image Map mode. Note that the sample requires the Microsoft AJAX for ASP.NET libraries.
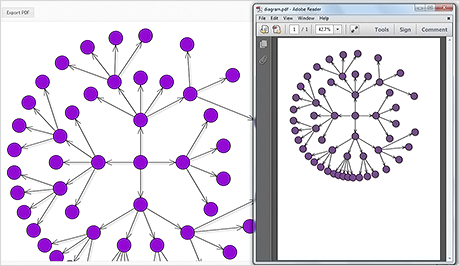
Other than rendering the diagram in the browser, your users might want to view it in another format - say PDF for example. MindFusion Diagram library makes the process of exporting and importing the flowchart straightforward and intuitive. The library supports a variety of image and file formats to choose from and this sample demonstrates how easy it is to apply them. Here we save a diagram from the browser to a Portable Document Format file with a click of a button. Try it yourself.
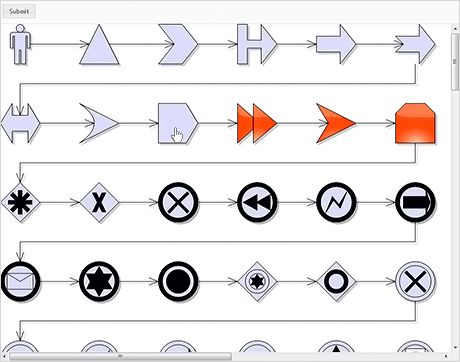
Diagramming for WebForms boasts a rich event set to make sure you have the right means to respond to every kind of action performed by the user. The library also offers an impressive variety of predefined node shapes to meet the diverse needs of today's web applications. In this sample we handle the NodeClicked event in ImageMap node. You see a flowchart where each node is one of the predefined node shapes and changes color when clicked. You can also witness how well the diagram is preserved between postbacks.
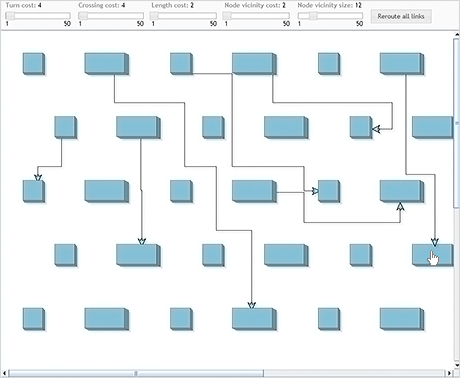
Routing e.g. the path a link follows between its origin and destination node - is important especially if the nodes contain text, images and other data, which better not be stricken. MindFusion Diagramming for WebForms takes routing to a whole new level with its advanced routing algorithm. The algorithm calculates the best rout between two nodes based on a variety of criteria, which are regarded as penalty costs. All details of the rout - turns, length, node crossing and node vicinity - are calculated with great precision to give the best possible path. Run this sample and witness this amazing process in action.
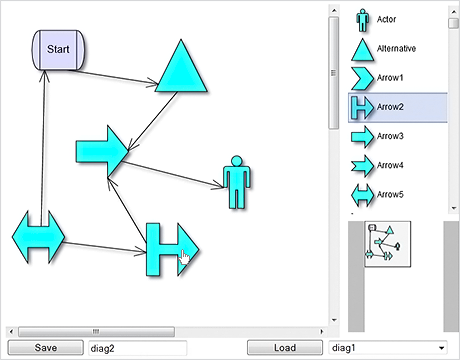
With MindFusion Diagramming you can not only create any type of flowchart with ease - it is equally fast and simple to save and load your diagrams. This sample combines all parts of the process - you start with a blank drawing area where you can create your diagram from scratch by dragging nodes from the list box on the left. Then you can save the diagram under a random name and load it later. The sample uses Sql Server as a storage utility.
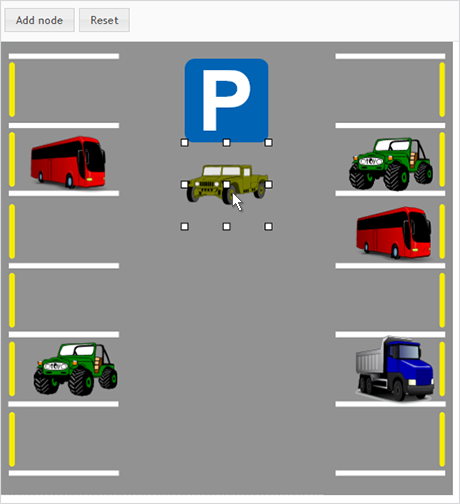
SVG nodes give you the freedom to create a node from any SVG graphic. Pair this practical feature of the component with the ability to use an image as a diagram background and you can reproduce vertically any chart where the standard diagram appearance is replaced by pictures, which can be resized, moved, connected etc. This comes mighty in a variety of scenarios like traffic schemes, online games, interior planning and many, many more. This sample represents a parking lot, where the vehicles are SVG diagram nodes. Park them wisely!
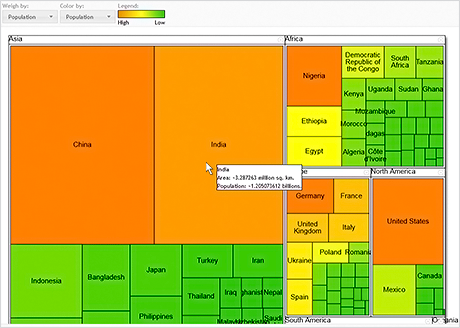
Diagramming for ASP.NET offers you a wealth of layout algorithm and this sample presents you an intriguing one - the TreeMap layout. Tree maps represent hierarchies by nesting child nodes within their parents, where the leaf nodes are proportional to their Weight values. The sample lets you choose among two weighs - population and area size of a country. The TreeMap algorithm then orders the states accordingly. You can also choose how countries are colored. The result is a beautiful tree map, where the size and color of the nodes clearly indicate the size and demographics of the country relative to those of the other countries at a glance.
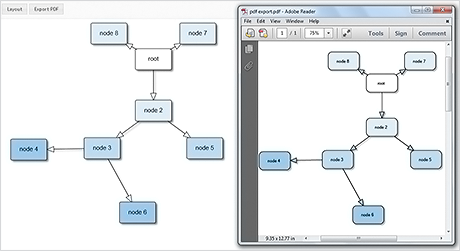
This tutorial teaches you everything you need to know to perform the basic operations on a diagram. You start by creating new nodes, then you arrange them by applying an automatic layout algorithm. Finally, you can export the finished diagram as a PDF file. Here it is worth noting how fast and seamless the control performs all user interactions and how easy to use its API is. When you open the PDF file you will see exact copy of the diagram you've just created.