Anchor Points
A demo of the various anchor points that diagram nodes can have and how you can customize their position and appearance.

Containers
The ContainerNode type is a special kind of node that can host other nodes and behaves as a single node: it can have a caption, styling and when dragged, all the nodes it contains move along.

Context Menu
The context menu is rendered when a diagram object is right clicked. It is completely customizable in terms of items, action and appearance.

Decision Flowchart
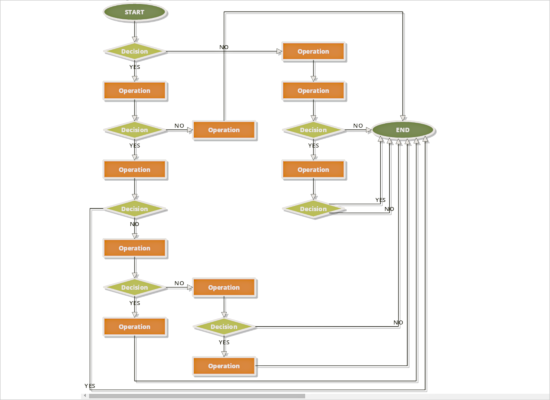
A diagram built from random nodes and links, which feature randomly assigned labels, is arranged with the DecisionFlowchart automatic layout. Since the diagrams are random, each new diagram and its arrangement result in a unique decision flowchart.

Exploring User Interaction
Learn how users can interact with the diagram; how nodes and links are created and edited; what are the different modes of diagram behavior.

Floor Planner
The sample demonstrates the context menu and shows how to save and load diagrams on the client side. It also uses custom shapes.

Fractal Layout
The Fractal layout is a type of algorithm that arranges diagram nodes at levels. Nodes at the lowest level are arranged around their parent. At the upper level, nodes from the lower levels are arranged to form branches around the new parent.

Inheritance
A class inheritance diagram where classes are represented by instances of TableNode-s. The diagram is arranged using the TreeLayout algorithm.

Layered Layout
The LayeredLayout algorithm assigns nodes to distinct horizontal and vertical layers according to several different criteria.

ListView-like TableNodes
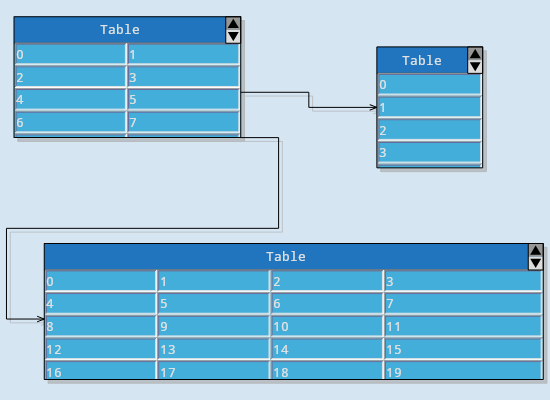
Build TableNode-s that calculate dynamically the count of rows and columns they should have in order to fit given text in cell with equal width.

Min App
This example demonstrates the minimal setup that lets you display the DiagramView component on a Blazor page.

Node List
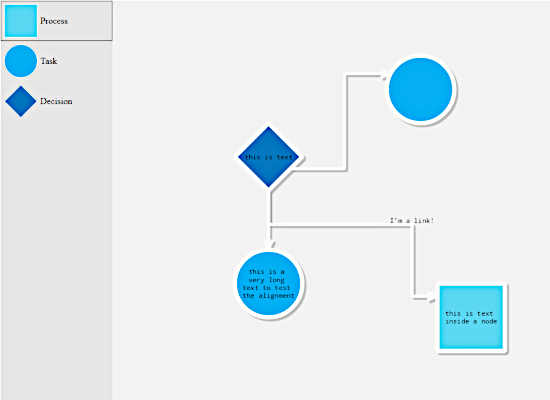
The NodeListView component is a tool palette where you can add any type of nodes, including custom ones. Users create instances of them through drag and drop.

Org Chart
An org chart that uses CompositeNode-s with two text components, an image, a border and two layout containers: a grid and a stack panel. The flowchart is arranged with a customized TreeLayout algorithm

Path Finder
The component boasts various methods, which allow you to find routs in a graph. The sample demonstrates two of them on a sample diagram.

Spanning Cells
TableNode instances can have an arbitrary number of rows and columns. Cells can span over several rows or columns and the sample shows you how to achieve this.

Tree Map
The TreeMap algorithm arranges nodes in containers and calculates their color and size based on a given weight.

Tutorial 1
Learn how to load graph data from XML and create diagram objects corresponding to the graph nodes and edges.

 Run
Run
 Download
