Right-click on the 'Run' button and choose 'Save as' if the *.jnlp file does not get saved automatically.
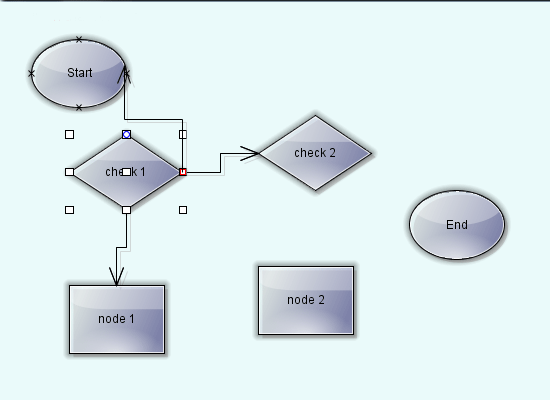
Anchor Points
Learn how to define custom anchor-point patterns and assign them to nodes. The library offers several predefined anchor patterns to choose from. One of them, DecisionBox, us used with the decision boxes in the sample diagram.
Anneal Layout
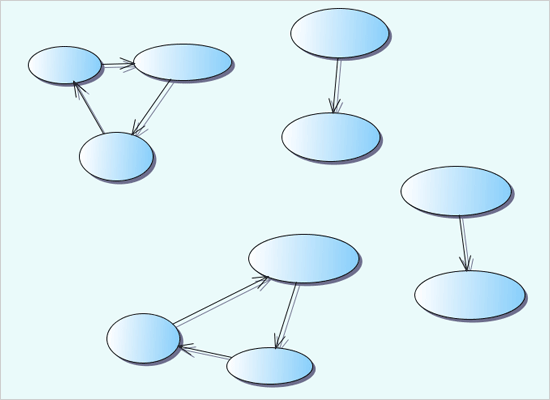
The sample demonstrates an an automatic graph layout algorithm based on simulated annealing - a general purpose optimization method that soles large scale combinatorial problems by simulating the process of healing and cooling of metal to achieve freedom of defects.
Class Diagram
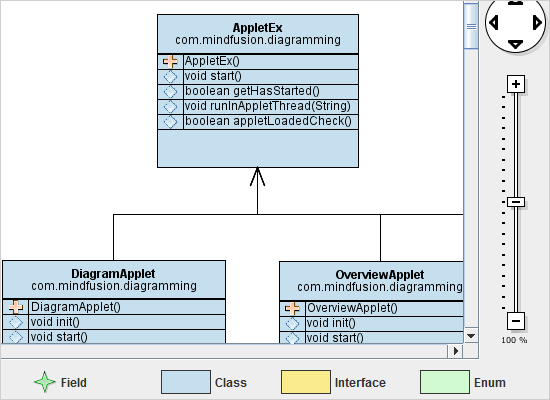
That's an end user application that parses an arbitrary jar file and uses the diagram library to render a class diagram with the data of the classes, enums and interfaces found in the jar. Each member is listed in a table together with its fields, methods and constructors.
Contact Tracing Manager
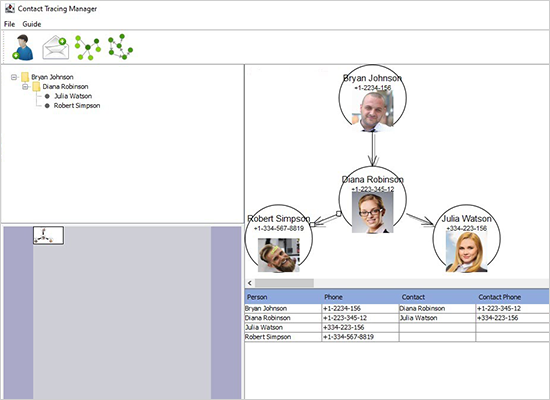
A contact tracing manager built in Java. The application stores the data in MySQL Database and uses the Diagram and Calendar libraries for the UI.
Controls
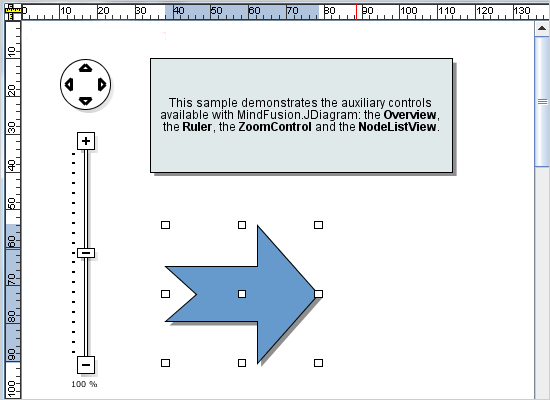
The Java diagram library comes with different auxiliary controls that are demonstrated in this sample: an overview, ruler, zoom control and a ShapeNodeList control, which lets you drag and drop diagram nodes.
Custom Drawing
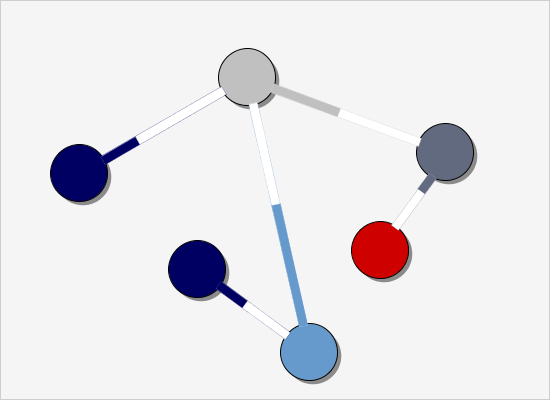
Diagram items offer not only rich choice of styling but also support custom drawing. This means you can entirely override the rendering of an item with your own drawing logic. The sample demonstrates how to apply that to diagram links.
Database Scheme
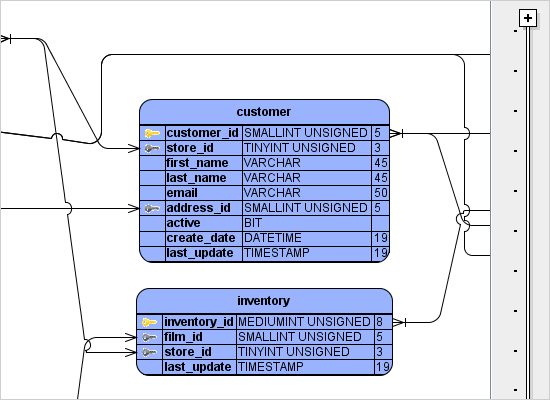
The sample connects to MySQL's Sakila database and reads the structure of its tables. It uses the diagram library to create a table with the data definitions of each table in the database and arranges the table using the layered layout algorithm.
Decision Layout
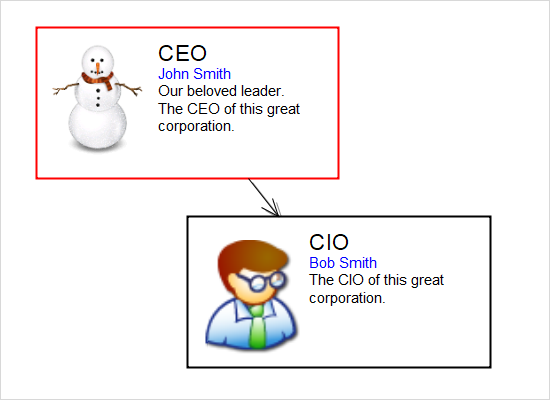
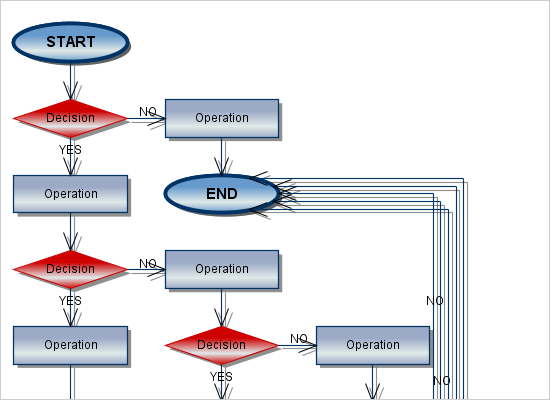
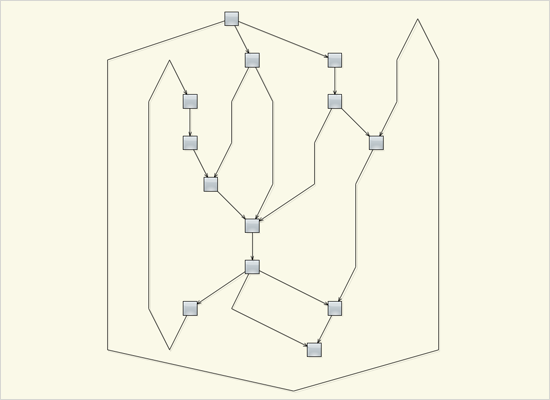
The sample uses the decision layout algorithm which is applied on a sample diagram that illustrates a decision tree.
Directory Tree
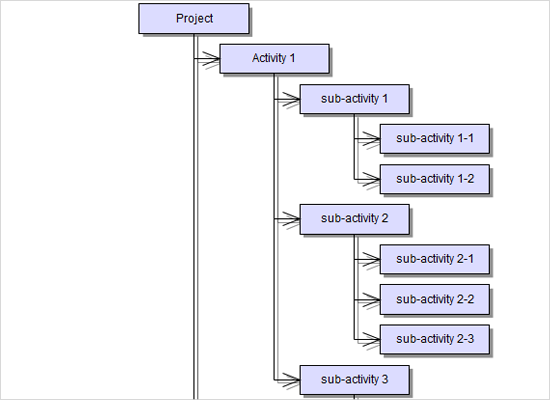
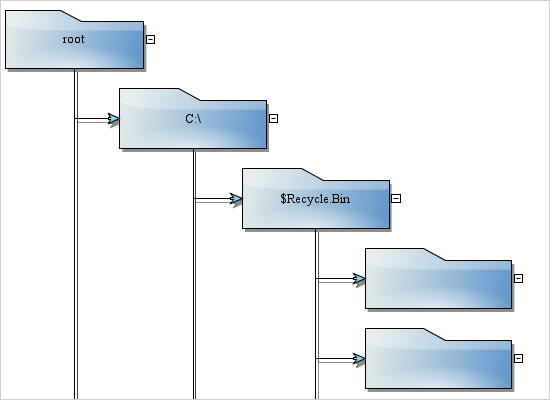
The sample uses the tree layout algorithm to arrange a diagram that illustrates the directory structure on your local hard disk.
Dynamic Dashboard
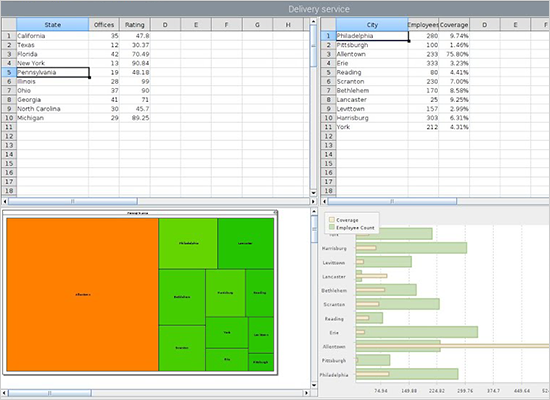
A dashboard that contains a spreadsheet, a treemap diagram and an overlay bar chart. The data is provided through XML. The diagram and chart are updated when the user changes the cell selection in the first spreadsheet.
Effects
You can choose among a variety of effects to apply on diagram nodes - glass, aero, metallic, glow and more. Each effect comes with a set of customization options like opacity, glow color, shade and reflection color etc. Effects can be combined.
Fishbone Diagram
Create fishbone diagrams interactively. Learn how to create derived node classes that implement custom drawing and how to override startCreate, updateCreate and completeCreate, and custom hit-testing by overriding containsPoint.

FlowCharter
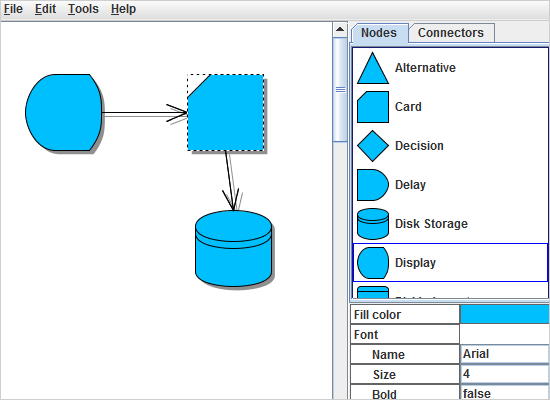
That's a complete diagramming application that lets users drag and drop diagram nodes from the NodeShapeList to the right, edit their properties and connect them. The sample also features an overview and a menu with settings.
Form Editor
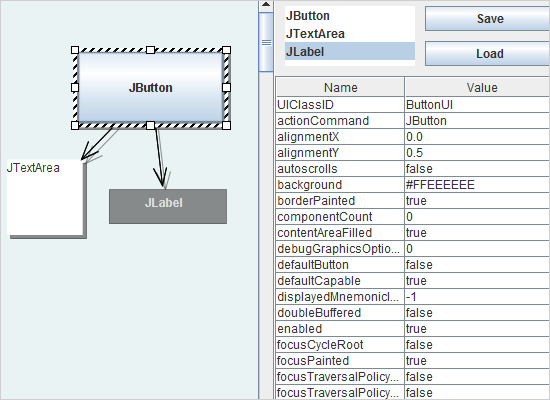
Here we use the ability of the diagram library to host any Java Swing control in a ShapeNode. You can drag and drop a JButton, a JTextArea or JLabel on the diagram work area and treat them the way you would any other diagram item or Swing component.
Fractal Layout
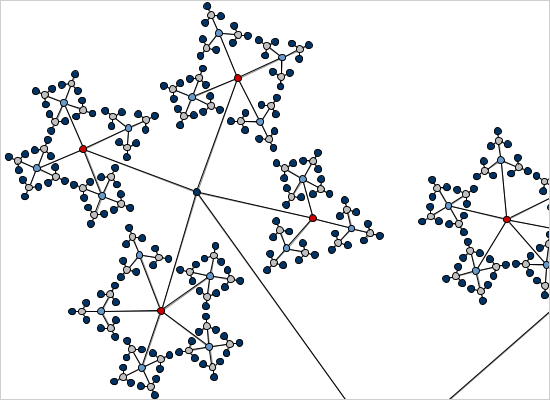
The fractal layout is used to arrange a randomly generated diagram. This algorithm places child nodes symmetrically around their parent node and the result diagram has fractal-like appearance. Each graph subset looks like a scaled-down version of the whole graph.
Icon Nodes
You can inherit the DiagramNode class and create your own diagram items which inherit the properties of the standard diagram class and add new ones. This sample shows you how to achieve that. When you click on the diagram surface a custom node object is created.
Interactive Tables
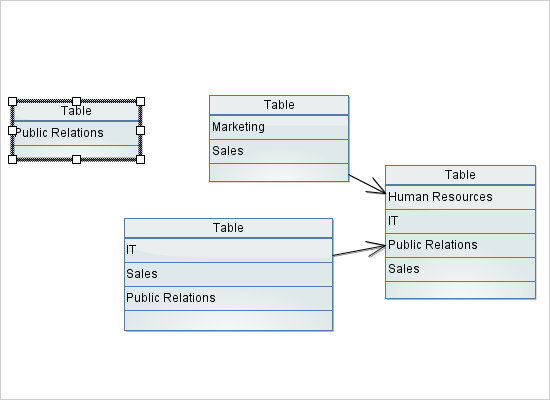
TableNodes in the diagram library can handle events that indicate which cell was clicked. In this sample a combo box is rendered whenever a user clicks on a cell. Drag the mouse on the work area of the diagram to create a new table.
JDiagram Demo
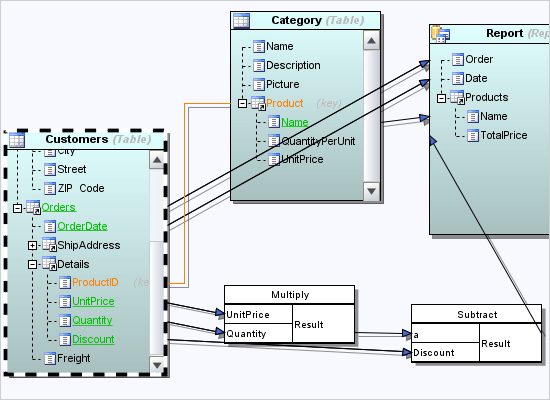
This is a Java application with multiple steps, which demonstrates different features of the flowchart library. You can see different types of flowcharts, trees and charts, various layouts, graph management features, appearance settings.
Lanes
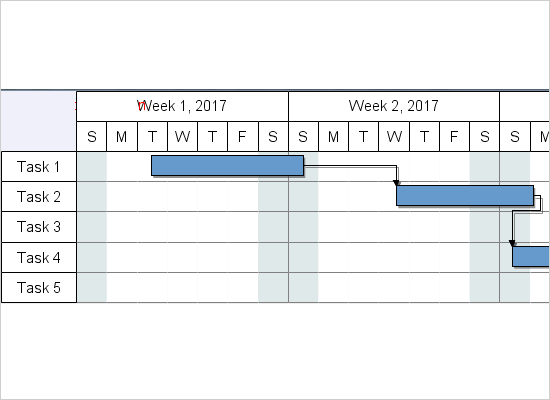
This sample uses the capability of the diagram library to arrange diagram items in lanes. When you create tasks you cannot drag the shape nodes between multiple lanes. The sample uses cascading links and imitates a Gantt chart.
Layered Layout
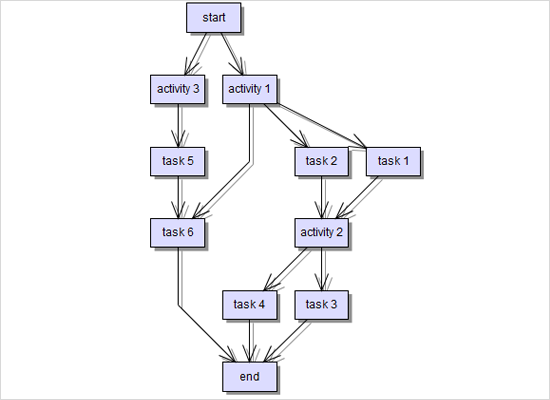
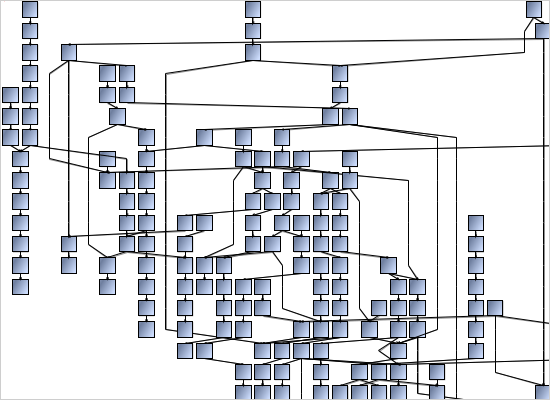
The layered layout algorithm arranges diagram nodes in layers, according to several criteria. Most important criteria are: connected nodes must be placed close together; links must flow in one direction if possible; links must cross as few layers as possible; links must not cross other links.
Magnifier
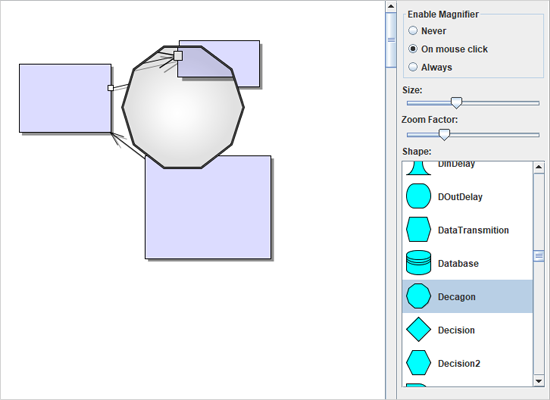
The magnifier tool can take whatever Diagram shape you want. It can be triggered in various ways and its size and zoom factor are customizable.
Multiple Views
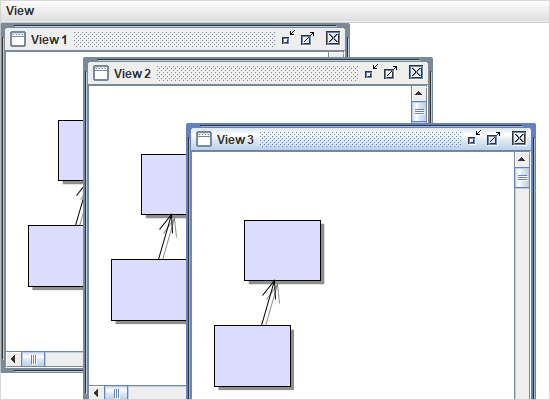
The sample shows how to render the same diagram instance in multiple views.
One-way Layout
The sample demonstrates the one-way layout algorithm where nodes are arranged in such manner that the links that connect them point in the same direction, when possible.
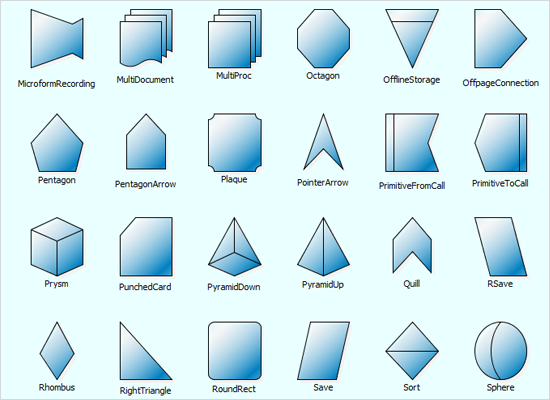
Predefined Shapes
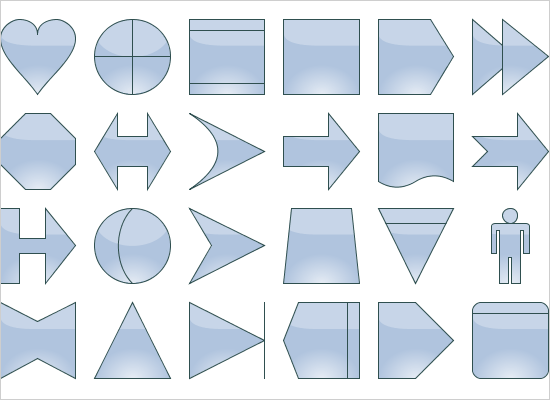
The sample demonstrates all predefined shapes that come with the Java diagramming library.
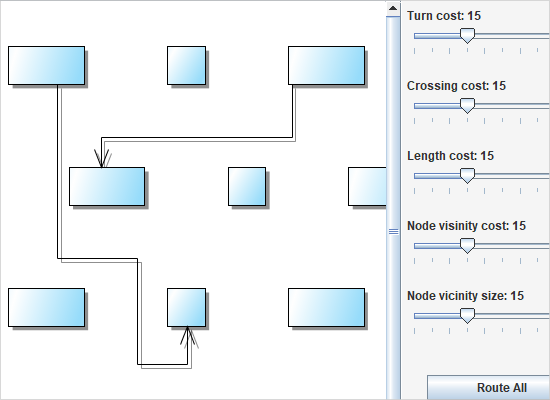
Routing
The sample lets you experiment with the various routing options for diagram links. You can change a given criteria and see how it effects the shape and length of the link.
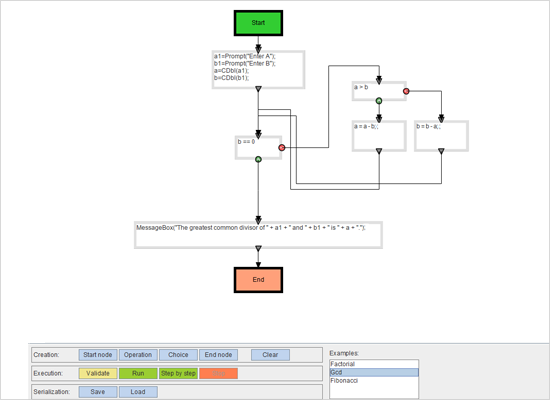
Scripting
This sample shows how to associate scripts with flowchart nodes to design and run actual algorithms represented by the flowcharts. The example also demonstrates how to integrate Swing components into a diagram using ControlNode class.
Site map
This sample demonstrates how you could let users create flowcharts faster by just drawing links from existing nodes to empty area on the canvas. The newly created nodes represent web pages and you can generate the HTML code for them.

Software Designer
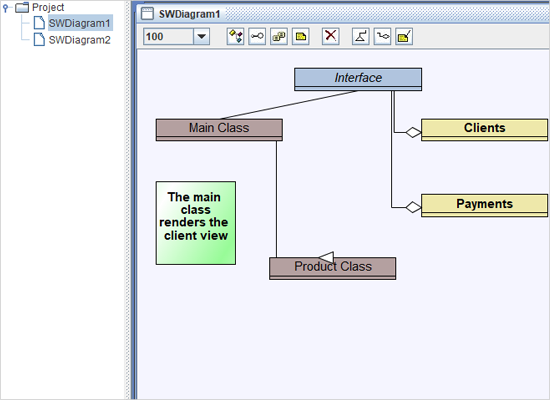
The sample allows users to create, edit and save simple UML-like class diagrams interactively.
Stress Test
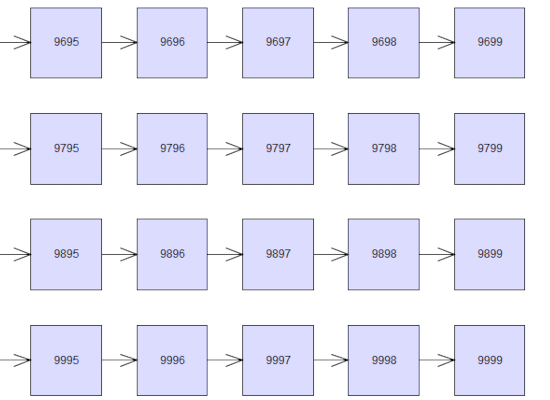
The samples lets you create 20000 nodes and links in total. The spatial indexing of the diagram allows for fast hit-test and viewport queries during rendering and user interactions.
TabbedView
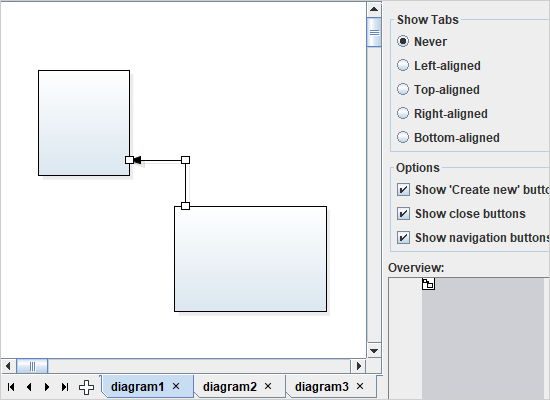
Demonstrates how to build multi-page diagrams and how to use the DocumentView control.
TreeMap
The sample shows the tree map layout algorithm. The sample renders the world population and area by country using nested rectangle diagram nodes.

Tutorial #4
The sample shows how to enable undo/redo support and serialization for custom nodes.
 Run
Run
 Download
