Adjustment Handles
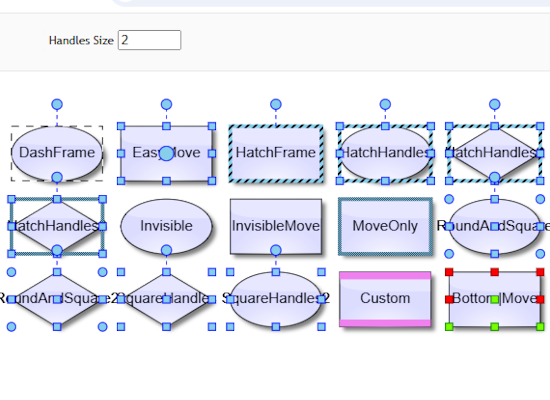
A node's adjustment handles can be styled through the DiagramNode.handlesStyle property. You can choose between the built-in styles or use custom drawing and custom hit-testing to achieve the desired look and feel.
Anchor Points
The sample demonstrates what anchor patterns are, how to create your own anchor patterns or load one of the predefined and how to apply them on diagram nodes.

Animations
The sample teaches you how to use the Animation object to achieve effective diagram rendering. You can test various animation and easing types applied on a flowchart that is built dynamically based on user input.

BPMN Diagram
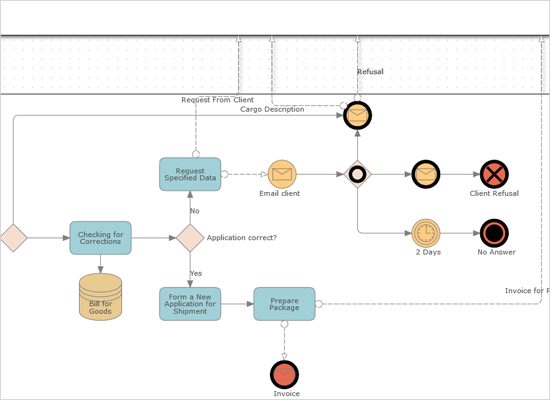
This is a sample BPMN diagram application. Click on a button to select the connector type. Change the color of nodes with the color picker. Double click on a link or node to add text. Save and load the diagram to/from local storage.
Christmas Diagram
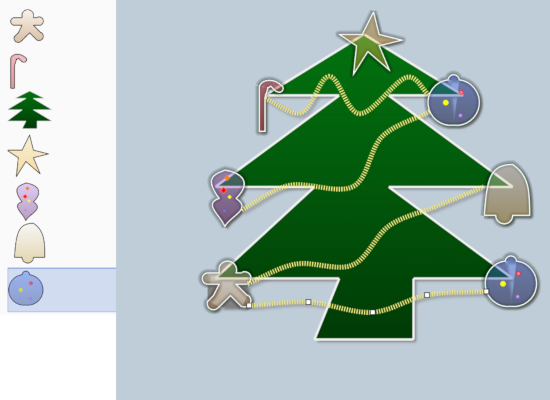
An interactive Christmas diagram web application that loads custom shapes from a shape library and uses link customization to draw garlands.
Class Inheritance
TableNodes are used to represent all major classes in the diagram library. The prototype of each class is questioned for a list of the available properties. After the diagram was built, the tree layout is applied to arrange it.

Containers
Container nodes are used to demonstrate how you can group and sort items using the ContainerNode object. Containers can be folded, styled and participate in layout algorithms just like the other ShapeNode types.

Controls
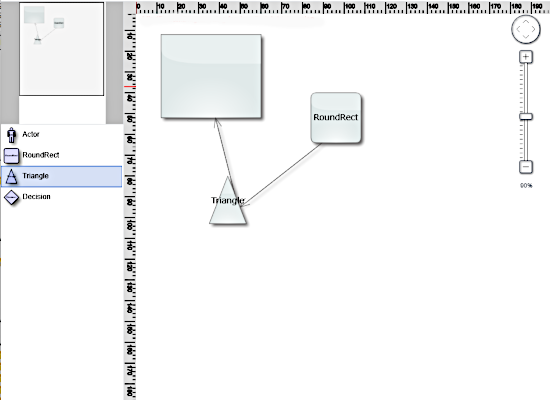
A presentation of the auxiliary controls that go with the diagram library - Overview, NodeListView control and Zoom control.

Database Designer
A database designer application that generates the SQL for updating the database. Users can create and rename tables, link them row to row as well delete them. They can also create, edit and delete table rows.

Decision Tree
The sample demonstrates how to build a step-by-step decision tree with nodes that list available options at each step. Nodes at the last level are arranged with the TreeLayout.

DevOps Process Diagram
A devops app with a custom shape, image shapes, customisable color of nodes, in-place text edit and the ability to save and load diagrams from the browser.

DOM Tree
Build a tree dynamically and let users expand or collapse tree branches. In addition, the sample demonstrates how to apply and customize the tree layout.

Event Sequence Diagram
A typical event sequence diagram, which users can customize with a change of background colour for nodes as well as adding/deleting nodes and connectors.
Export/Import To/From Custom Json
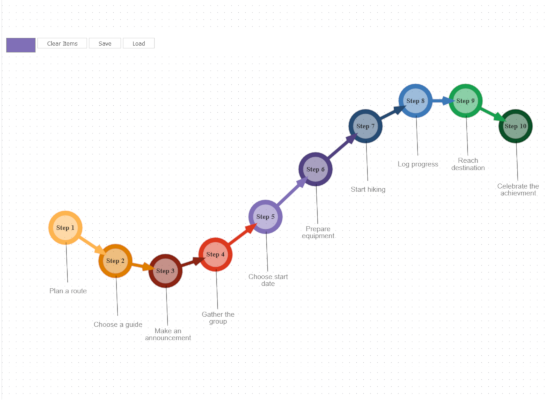
The sample exports only a part of the diagram data into a json and loads it. The built-in toJson/fromJson methods export/import all the diagram data.
Flowcharter
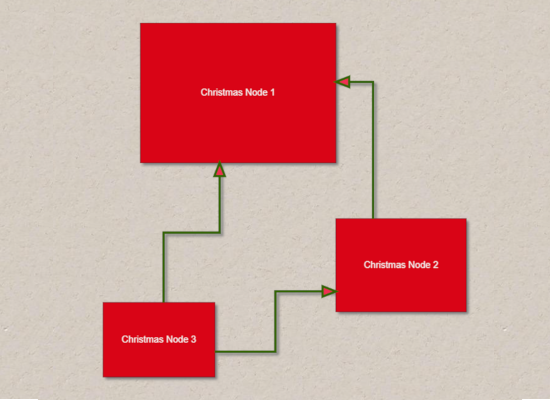
A complete ready-to-use diagramming application that initializes with a flowchart built in code. Users can customize the diagram nodes, add / delete nodes and save / load diagram through localSotrage.

Fractal Layout
The fractal layout is used to arrange a randomly generated diagram. This algorithm places child nodes symmetrically around their parent node and the result diagram has fractal-like appearance. Each graph subset looks like a scaled-down version of the whole graph.

Improving Link Legibility
A demonstration of some of the options to position links in such a way that makes them easy to follow.
Lanes
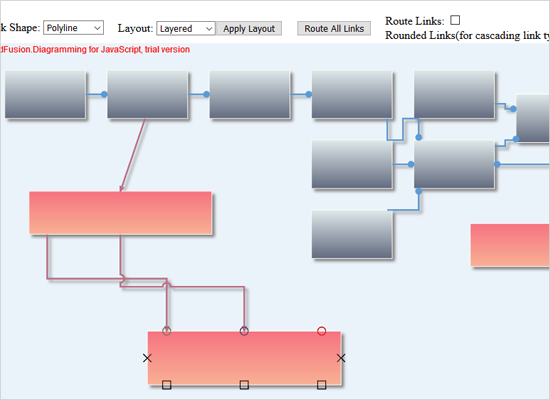
The diagram's lane grid is used to render a Gantt chart where grid columns are painted differently. Each newly created flowchart item is aligned automatically to a lane chosen by the user.

Layered Layout
The layered layout algorithm is applied on a randomly generated graph with large number of nodes. The layout aims to order nodes at similar distance from the root in layers.

Mouse Events
Learn how to implement programmatically pan and zoom in a JavaScript diagram.
Multiple Parents
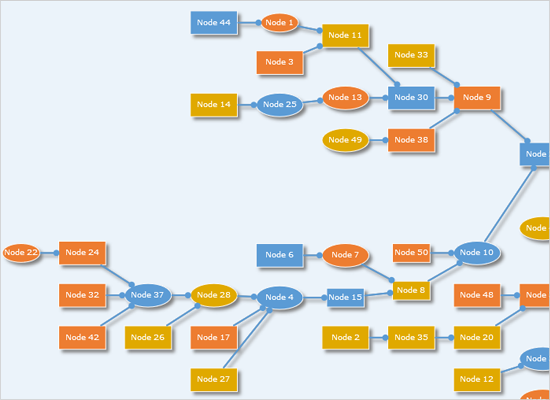
This sample loads a graph where nodes can have multiple parents. The graph is arranged with the LayeredLayout automatic algorithm. Click on a button to select the connector type. Change the color of nodes with the color picker. Double click on a link or node to add text. Save and load the diagram to/from local storage.
Organizational Chart
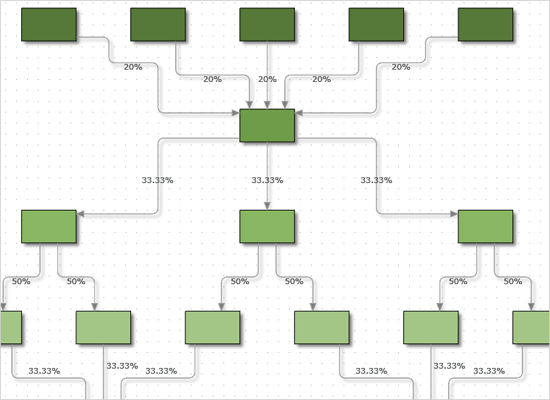
An organizational chart that uses custom TableNode-s to represent a hierarchy of employees. The sample offers plenty of user interaction - new nodes can be created, nodes can be rearranged and fields edited.

Pull Links Apart
This sample creates a flowchart and adds a few methods that distribute links connecting the same nodes.
Spanning Cells
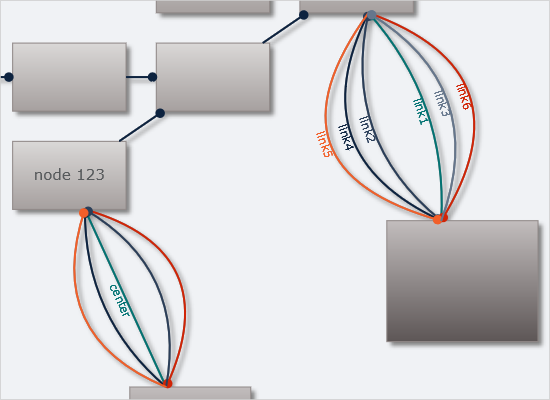
Three table nodes with numerous cells and rows demonstrate how you can apply the apabilities of the library to span rows, columns and create links between table rows of your choice.

Stock Shapes
An overview of the stock shapes available with the library. Besides a large set of ready-to-use flowchart node shapes, you can create your own shapes and save them.

Stress Test
The sample creates 20000 nodes and links in total. The Diagram's spatial indexing allows for fast hit-test and viewport queries during rendering and user interactions.
SVG Nodes
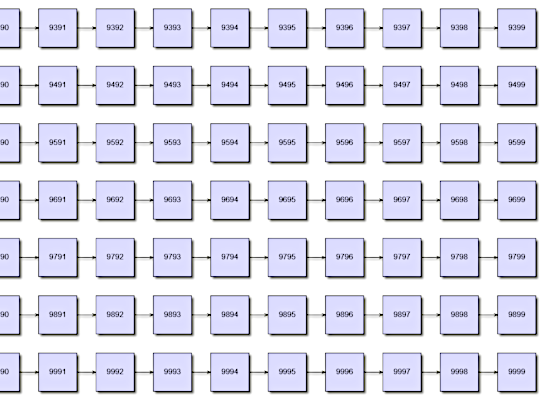
SvgNode objects are created here to imitate vehicles on a parking place. The background of each node is a SvgImage, the background of the diagram is a png image file.

Tree Layout
Users can drag nodes from the NodeListView control to the left and drop them onto each other. The newly created nodes automatically get arranged using the TreeLayout algorithm. The final result is a graph imitating a tree where each node is a leaf.

TreeMap
The treemap layout uses given weigh value for each node as a guide about the size of each rectangular node it draws. A second criteria determines the coloring of the nodes.

TreeMap Chart for Lithium Production
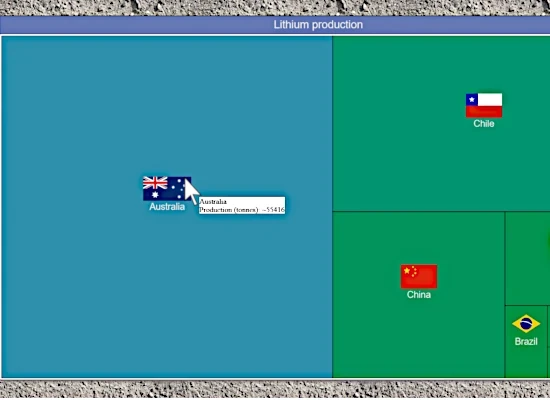
A TreeMap diagram that reads its data from an XML file and applies the TreeMapLayout. The diagram has a tiled background image, nodes contain text and image and render tooltips.
Tutorial #1
A basic guide on how to build diagram nodes and links from jason data and how to apply the layered layout on the new graph.

Tutorial #2
Here you read information for the flowchart from json data and arrange the newly created diagram with the BorderedTreeLayout.

Tutorial #3
Here a custom node class is used that exposes some new properties in addition to the ones defined by DiagramNode and implements its own drawing logic.

Tutorial #4
In addition to custom node class, this tutorial adds clipboard operations: copy, cut, paste, undo and redo. The custom nodes are added to a NodeListView control and users can drag and drop them.

 Run
Run
 Download
